Appendices
Appendix D
ViDoRe v3 Appendix
Dataset examples
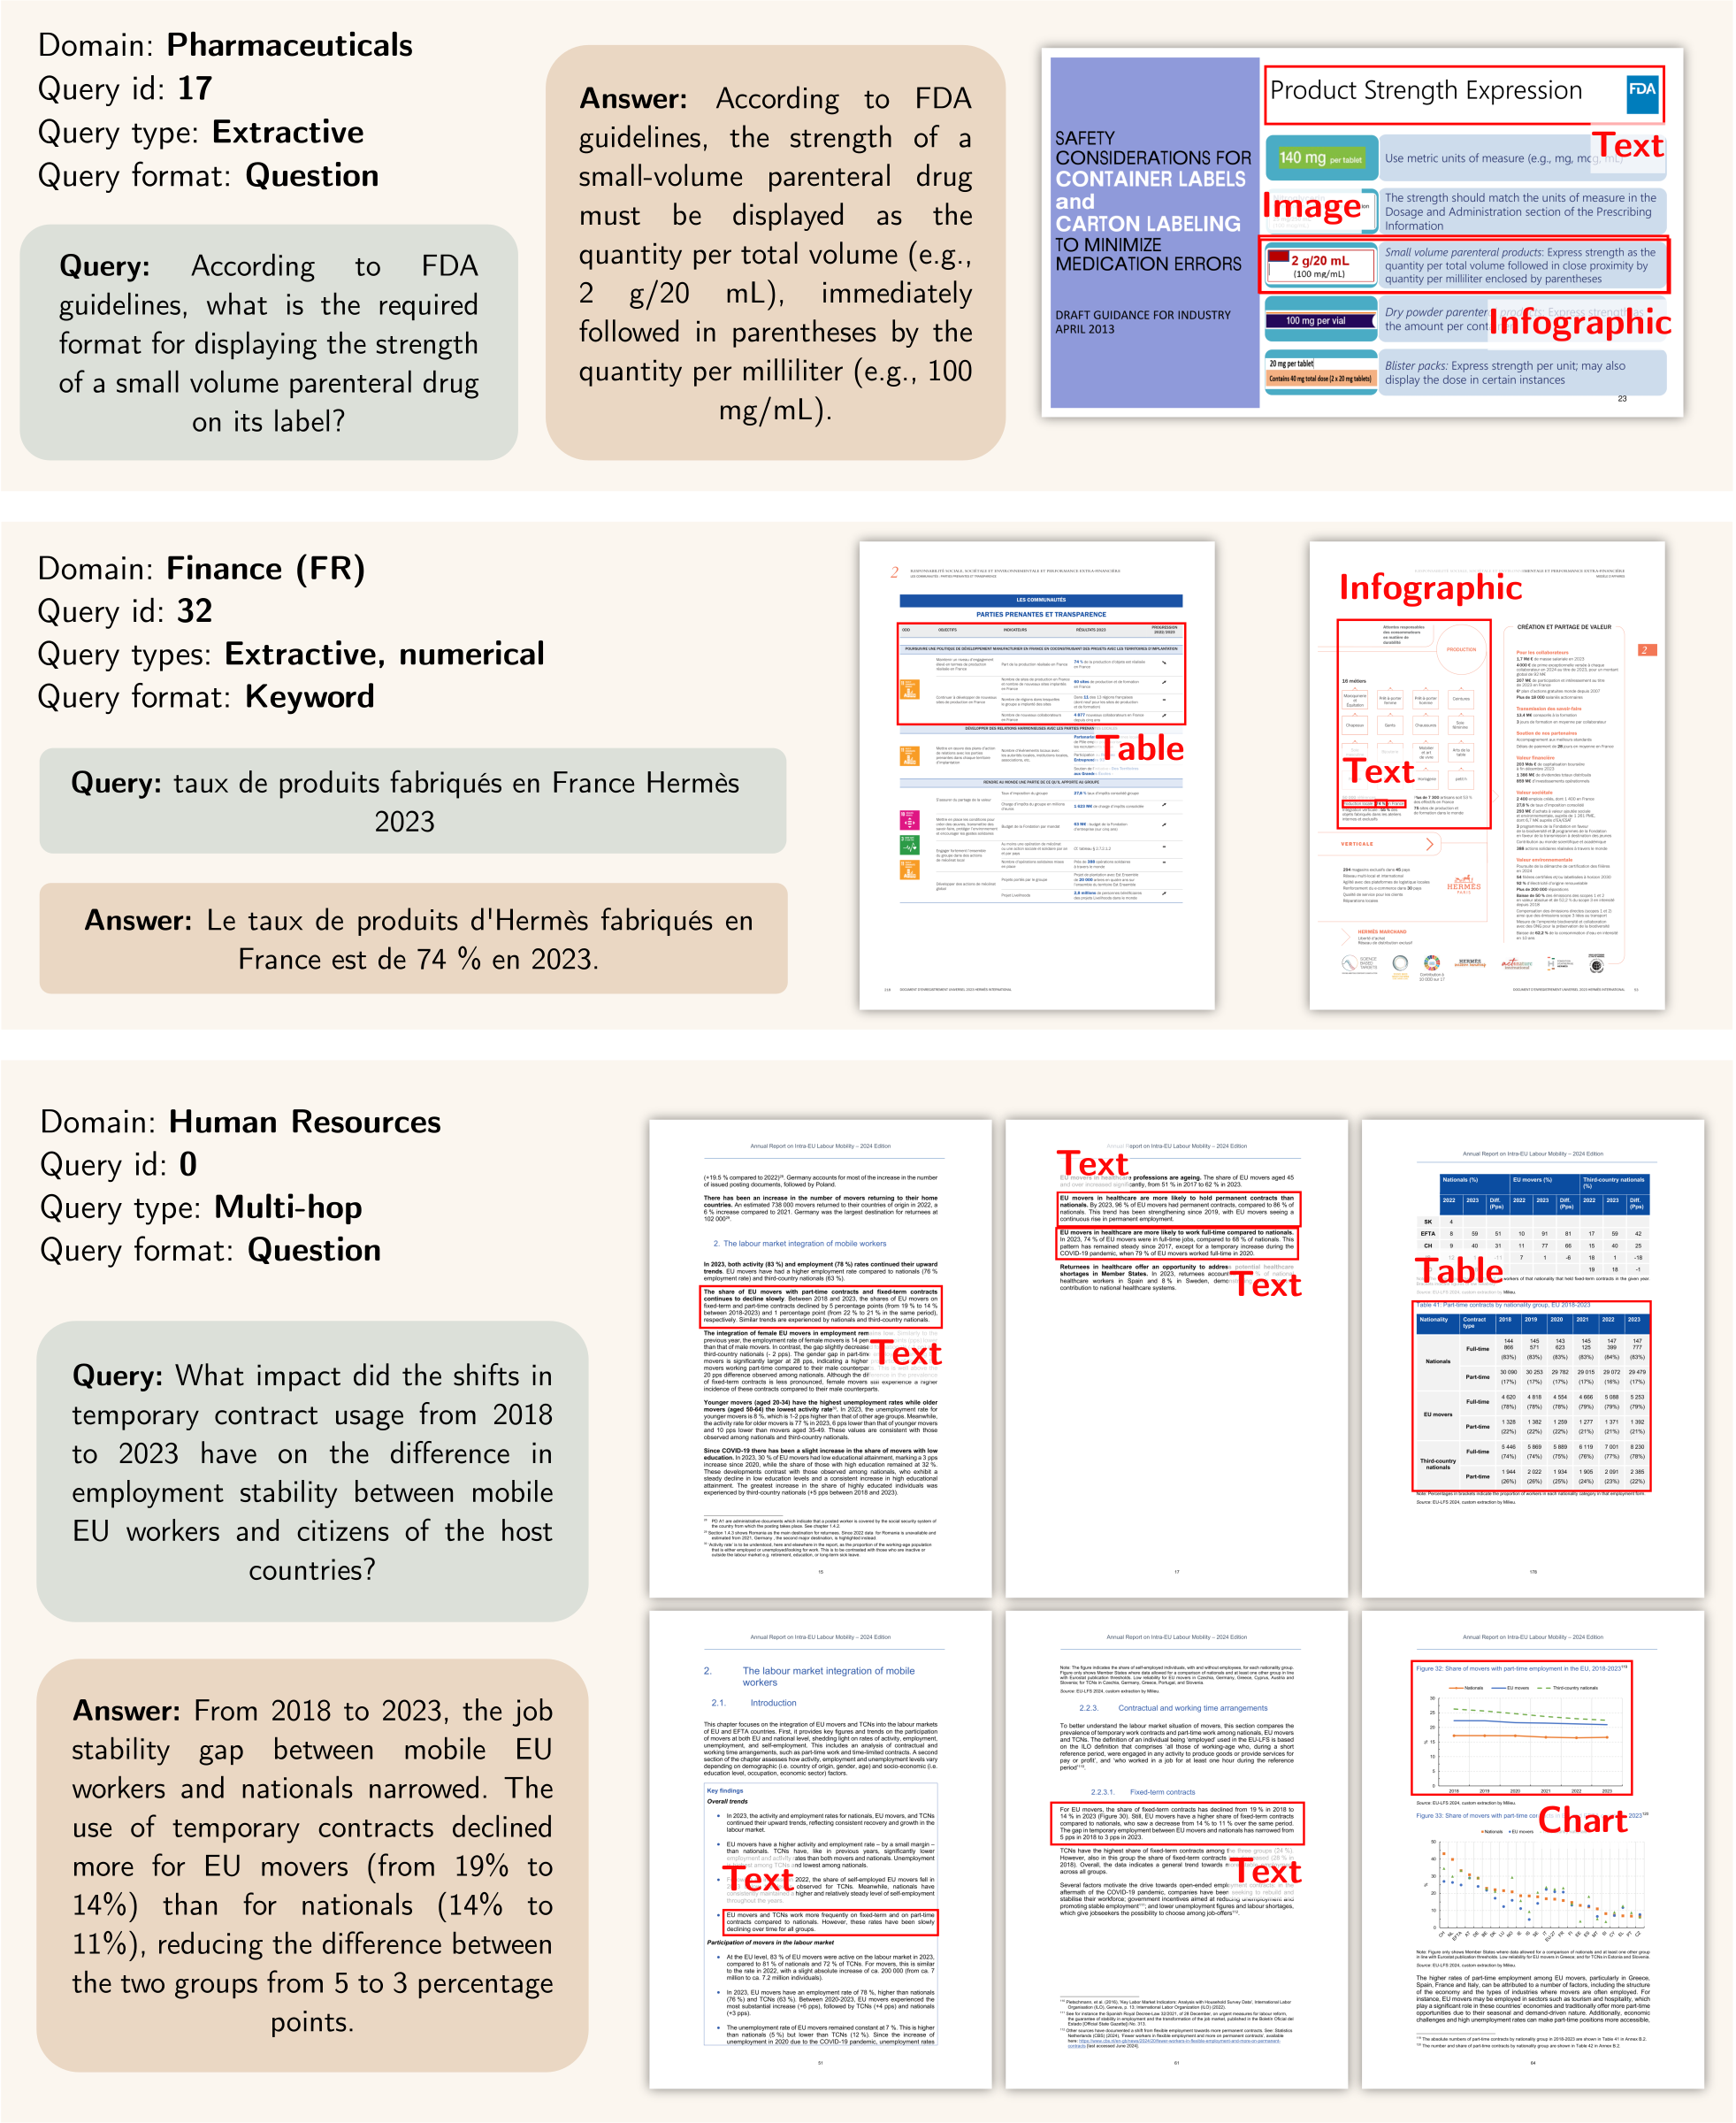
Supplementary benchmark details
Domains
Table 2 details the type of documents used in each corpus as well as several statistics.
Query type and format descriptions
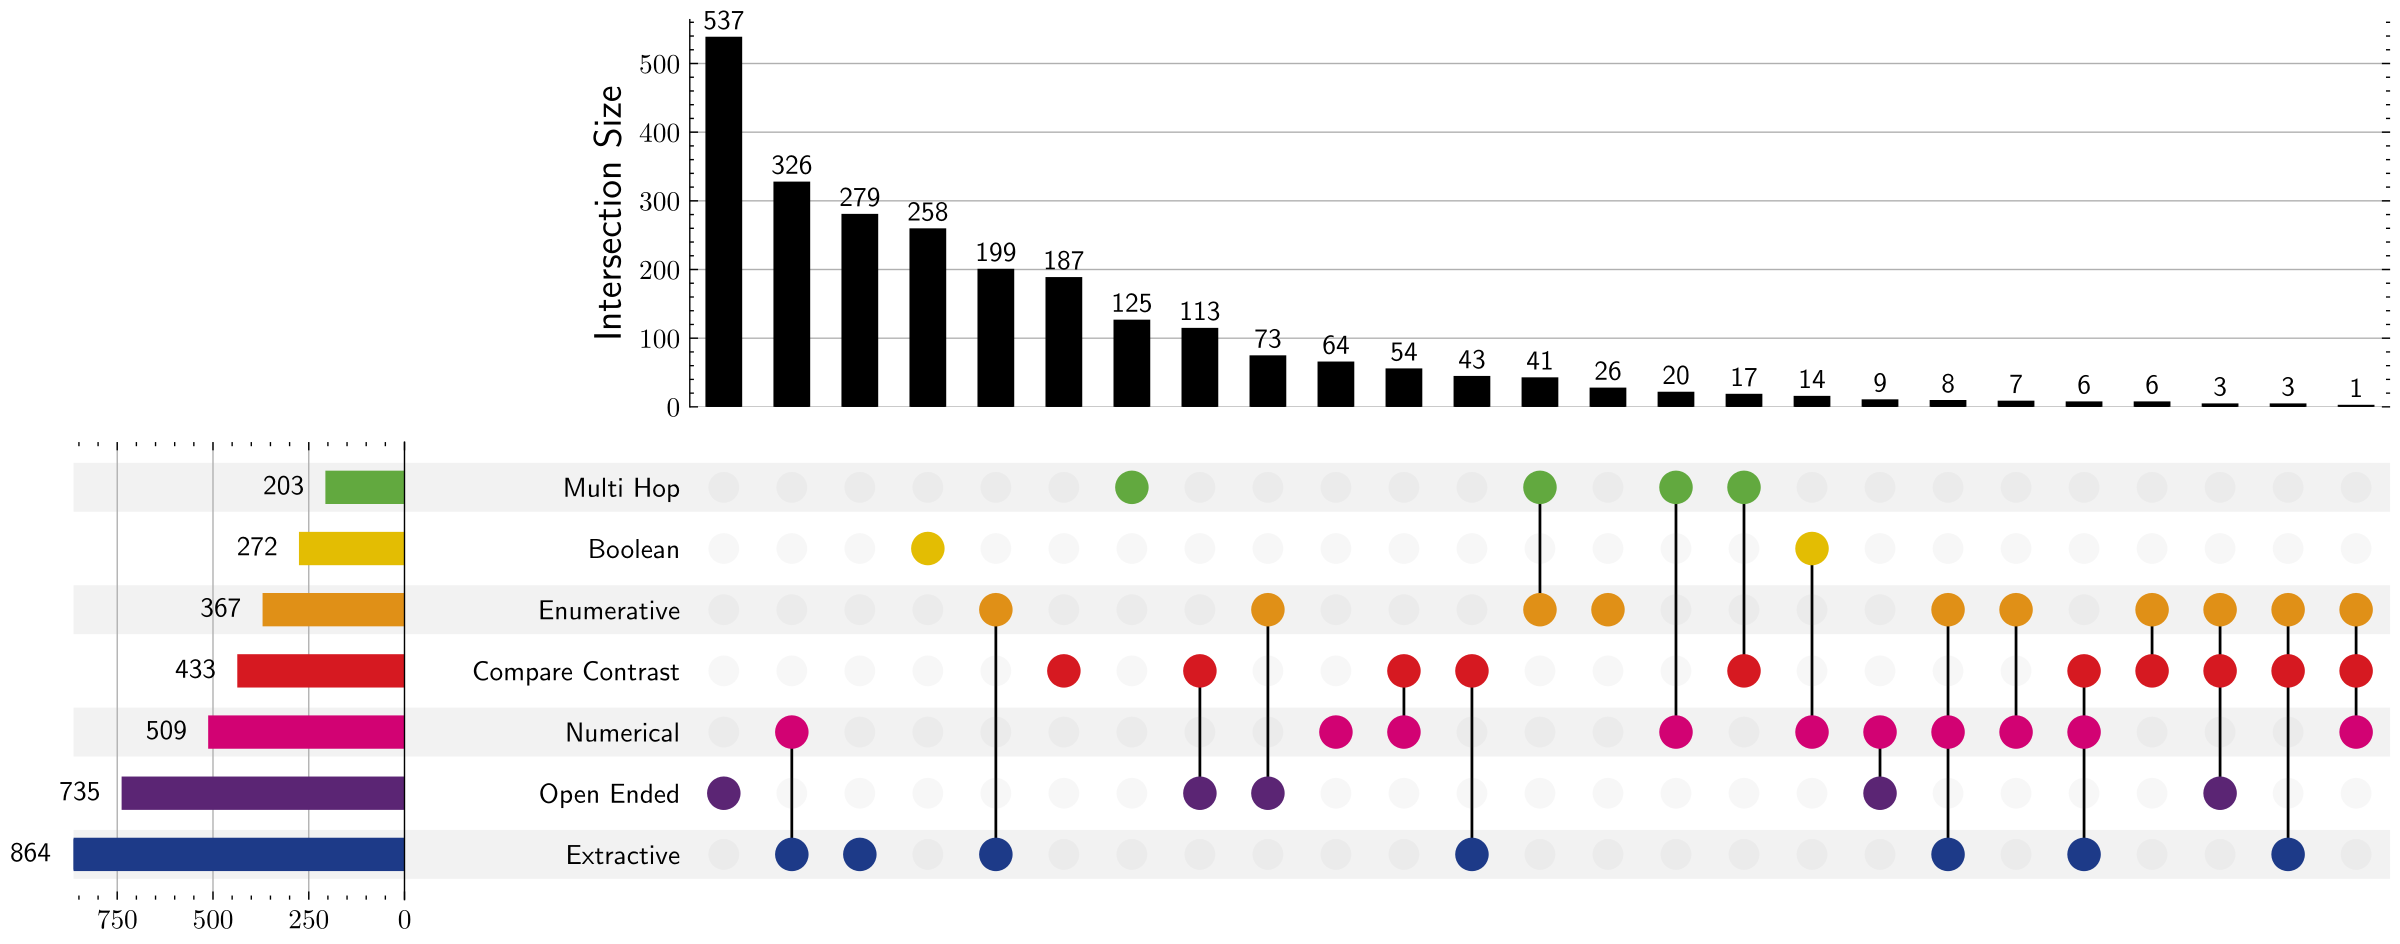
Table 1 describes the types and formats of the queries, while Figure 2 gives details about query type intersection frequency.
Query type by generation method
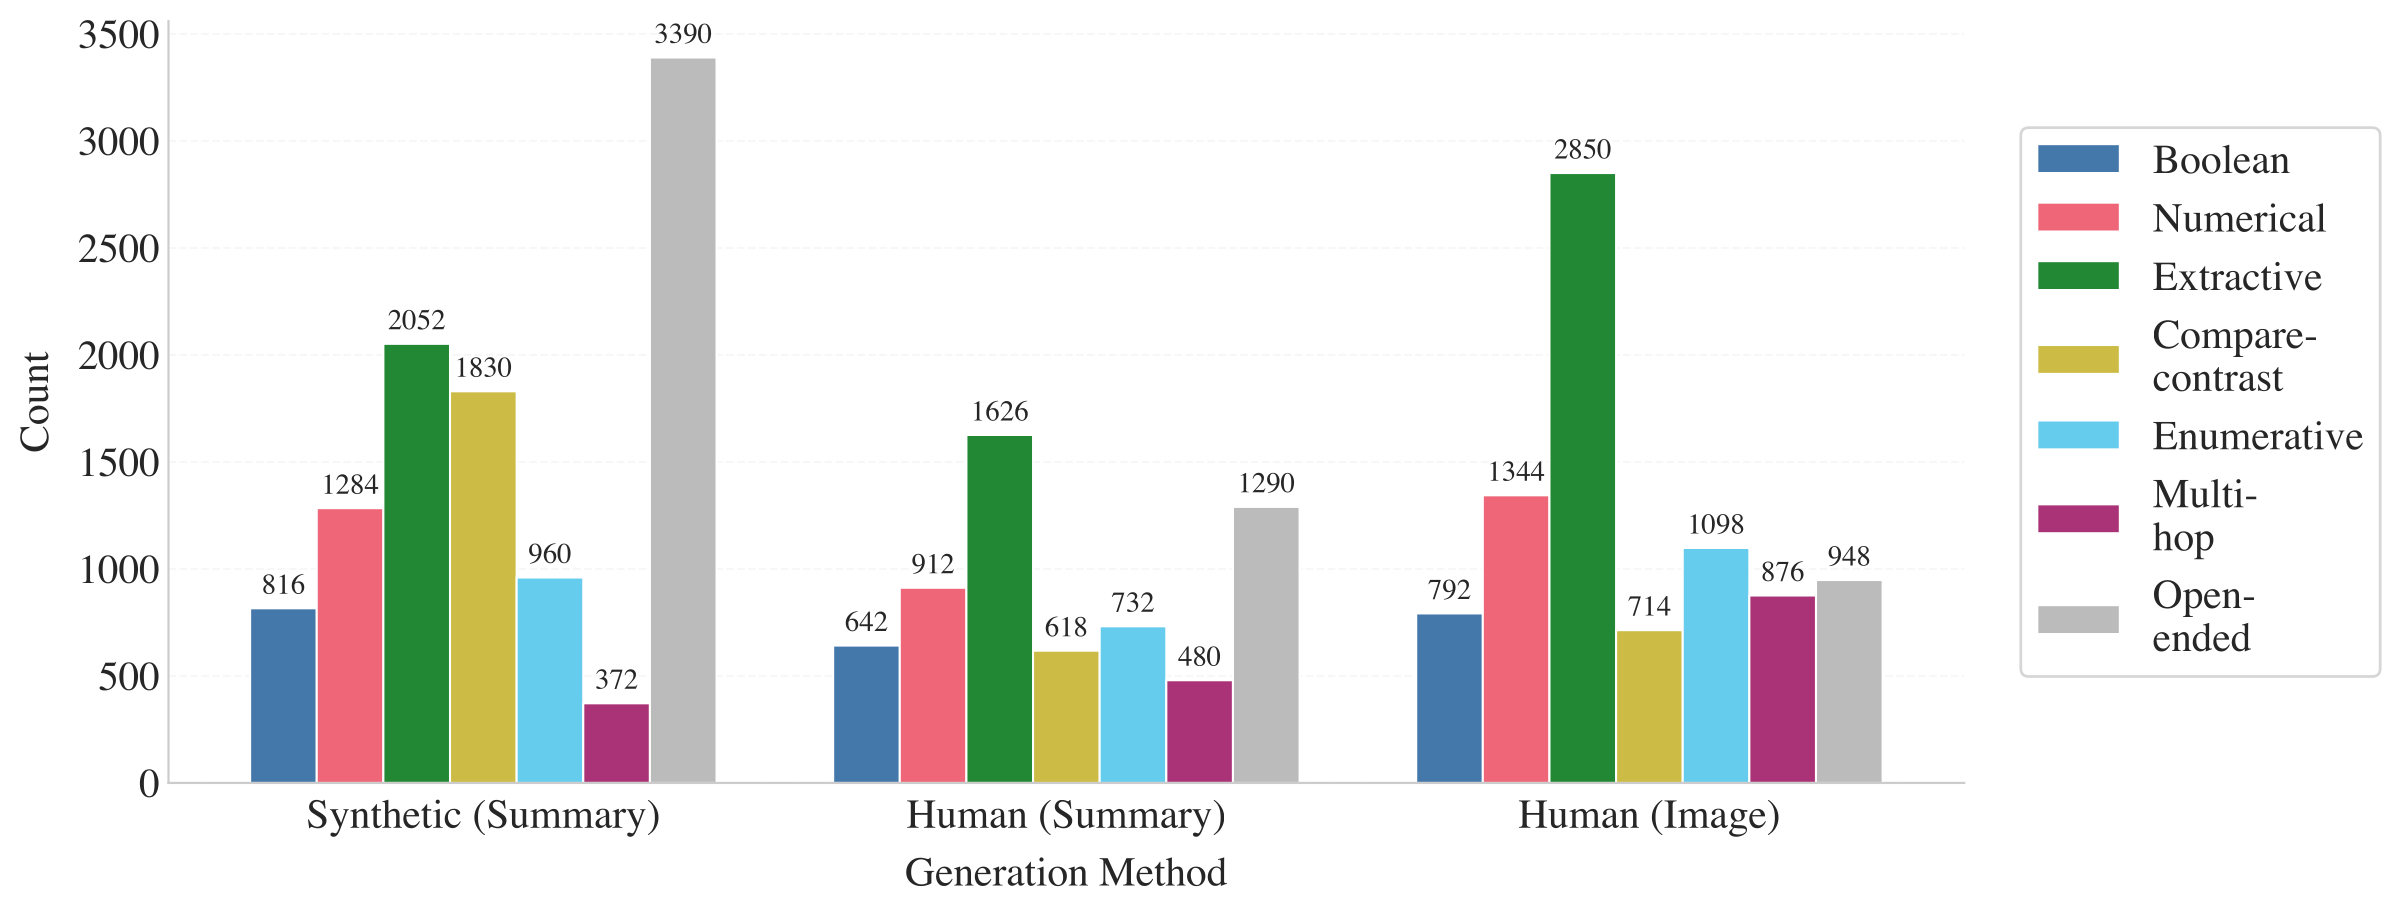
Query type distributions by generation method (Figure 3) confirm that open-ended queries dominate synthetic queries as the synthetic pipeline attributed more weight to this type, while extractive queries dominate human-image queries since they are more naturally chosen by annotators.
Annotator pool and training details
Annotator Pool and Selection.
Annotation was conducted by a curated pool of 76 annotators who were selected based on having: (1) a bachelor's degree or higher in the relevant domain, (2) professional experience in the domain, (3) native-level language proficiency as required by task, and (4) prior experience with RAG, retrieval, or VQA annotation projects. Quality control was performed by 13 senior annotators with enhanced domain knowledge and extensive annotation experience, with project oversight provided by data leads with multiple years of experience in human data generation.
Training and Pilot Phase.
The annotation process began with a comprehensive onboarding phase where annotators received task-specific training using gold-standard examples. For each domain, a pilot of several hundred tasks was conducted with 100% quality control coverage and multiple annotators per task. During this phase, data leads and the research team continuously evaluated annotations, provided clarifications, and refined guidelines. Inter-annotator agreement and time-per-task baselines were calculated to establish ongoing evaluation benchmarks. The pilot concluded upon validation of both data quality and guideline effectiveness.
Supplementary agreement metrics
Pages were pre-filtered by a VLM before human annotation; as most pages shown to annotators were likely relevant, this created a skewed class distribution. This prevalence imbalance causes traditional chance-corrected metrics like Krippendorff's Alpha to appear paradoxically low even when annotators genuinely agree, as inflated expected chance agreement penalizes the score. To address this, we report 2 complementary metrics: Krippendorff's Alpha (ordinal) as the standard measure and Gwet's AC2 which remains stable under prevalence skew. Overall, annotators achieved , AC2 . The divergence between Alpha and AC2/Weighted Agreement is expected given the pre-filtered data and confirms substantial agreement despite the skewed distribution.
Supplementary retrieval details
Retriever model reference
Table 4 lists the retriever models evaluated in this work, along with their HuggingFace model names and citations.
Monolingual performance
Tables 5 and 6 present the monolingual performance of our models, where retrieval is conducted using language-matched queries and documents for English and French, respectively.
| Category | Definition | Example |
| Query Types | ||
| Open-ended | Seeks explanatory or descriptive information that requires synthesis. | What drives the rise in women's workforce involvement in EU nations? |
| Extractive | Requires the retrieval of a specific piece of information. | Bank of America preferred stock MM dividend rate |
| Compare Contrast | Mandates a comparison between multiple entities or data points. | Explain the factors contributing to the reduction in R2R rates for ANDAs. |
| Boolean | Poses a yes/no question necessitating multi-step reasoning. | Did JPMorganChase execute more than half of its planned repurchase program? |
| Numerical | Asks for a specific quantitative value that must be derived or calculated. | percentage increase in Morgan Stanley revenue from 2023 to 2024 |
| Multi-hop | Requires integrating information from multiple sections or sources. | Summarize the steps involved in error reporting in ISMP's MERP. |
| Enumerative | Requests a list of all instances sharing a common property. | Specify the ISCO codes used to define domestic workers in the EU. |
| Query Formats | ||
| Question | An interrogative sentence. | What was Citigroup's net interest margin in 2024? |
| Keyword | A non-verbal phrase or set of terms. | female employment rate European Union 2023 |
| Instruction | A directive specifying a task. | Identify the use case of a drill point gauge. |
| Corpus | Domain(s) | Description | Lang. | # Docs | # Pages | # Queries | Main modalities |
| U.S. Public Company Annual Reports | Finance-EN | Consists of 6 10-K annual reports from major U.S. financial institutions for the fiscal year ended December 31, 2024. | en | 6 | 2942 | 309 | Text, Table |
| Computer Science Textbooks | Computer Science / Education | Consists of two open-source, peer-reviewed textbooks from OpenStax covering foundational topics in computer science, Python, and data science. | en | 2 | 1360 | 215 | Books |
| FDA Reports | Pharmaceuticals | Consists of FDA presentations and Springer books (2016–2023) covering regulatory policies, drug development, and public health initiatives. | en | 52 | 2313 | 364 | Slides, Books |
| HR Reports from EU | HR | Includes recent European Commission reports and papers on EU labour markets, social development, and employment policies. | en | 14 | 1110 | 318 | Reports |
| USAF Technical Orders | Industrial Maintenance | Comprises U.S. military technical orders and manuals for aircraft maintenance, safety procedures, and material handling, revised through 2025. | en | 27 | 5244 | 283 | Manuals |
| French Physics Lectures | Physics | A collection of educational materials offering an interdisciplinary exploration of modern physics and complexity science. | fr | 42 | 1674 | 302 | Slides |
| French Public Company Annual Reports | Finance-FR | Contains the 2023–2024 annual reports of major French luxury companies (Dior, Hermès, Kering, L'Oréal, LVMH). | fr | 5 | 2384 | 320 | Reports |
| French Governmental Energy Reports | Energy | Gathers official documents from French public agencies on energy, economic, and environmental issues in France. | fr | 42 | 2229 | 308 | Reports, Slides |
| Dataset | (ord) | Gwet's AC2 |
| Computer science | 0.467 | 0.809 |
| Energy | 0.463 | 0.714 |
| Finance (EN) | 0.514 | 0.798 |
| Finance (FR) | 0.320 | 0.736 |
| H.R. | 0.413 | 0.793 |
| Industrial Maintenance | 0.496 | 0.740 |
| Telecom | 0.464 | 0.772 |
| Nuclear | 0.389 | 0.794 |
| Pharma | 0.478 | 0.755 |
| Physics | 0.213 | 0.334 |
| Overall | 0.469 | 0.760 |
| Model alias | Full model name | Reference |
| Qwen3-8B | Qwen3-Embedding-8B | (Zhang et al. 2025) |
| Jina-v4 | jina-embeddings-v4 | (Günther et al. 2025) |
| Qwen3-0.6B | Qwen3-Embedding-0.6B | (Zhang et al. 2025) |
| LFM2-350M | LFM2-ColBERT-350M | (AI 2025) |
| BGE-M3 | BGE-M3 | (Chen et al. 2024) |
| BM25S | BM25S | (Lù 2024) |
| ColEmbed-3B-v2 | llama-nemoretriever-colembed-3b-v2 | (Xu et al. 2025) |
| ColNomic-7B | colnomic-embed-multimodal-7b | (Team 2025) |
| ColEmbed-3B | llama-nemoretriever-colembed-3b-v1 | (Xu et al. 2025) |
| ColNomic-3B | colnomic-embed-multimodal-3b | (Team 2025) |
| ColEmbed-1B | llama-nemoretriever-colembed-1b-v1 | (Xu et al. 2025) |
| ColQwen2.5 | colqwen2.5-v0.2 | (Faysse et al. 2025) |
| Nomic-7B | nomic-embed-multimodal-7b | (Team 2025) |
| ColQwen2 | colqwen2-v1.0 | (Faysse et al. 2025) |
| Nomic-3B | nomic-embed-multimodal-7b | (Team 2025) |
| ColPali | colpali-v1.3 | (Faysse et al. 2025) |
| Mxbai Edge 32M | mxbai-edge-colbert-v0-32m | (Takehi et al. 2025) |
| GTE-ModernColBERT | GTE-ModernColBERT-v1 | (Chaffin 2025) |
| ColModernVBERT | colmodernvbert | (Teiletche et al. 2026) |
| ColSmol-256M | colSmol-256M | (Marafioti et al. 2025) |
| Model | Size (B) | C.S. | Nucl. | Fin. | Phar. | H.R. | Ind. | Tele. | Average |
| Textual Retrievers | |||||||||
| Jina-v4 | 3 | 67.3 | 48.2 | 56.5 | 59.0 | 58.8 | 45.8 | 61.0 | 56.7 |
| Qwen3-8B | 8 | 73.5 | 42.2 | 54.8 | 62.4 | 52.3 | 45.3 | 66.0 | 56.6 |
| LFM2-350M | 0.35 | 70.6 | 45.4 | 48.3 | 62.1 | 53.2 | 47.9 | 63.8 | 55.9 |
| Mxbai Edge 32M | 0.03 | 68.0 | 44.4 | 48.2 | 62.5 | 52.7 | 47.1 | 61.9 | 55.0 |
| BM25S | - | 64.7 | 45.9 | 49.9 | 56.9 | 49.6 | 45.6 | 58.3 | 53.0 |
| Qwen3-0.6B | 0.6 | 70.5 | 39.7 | 51.5 | 57.4 | 46.2 | 42.4 | 59.7 | 52.3 |
| GTE-ModernColBERT | 0.15 | 63.6 | 41.7 | 39.8 | 62.0 | 46.2 | 44.6 | 59.7 | 51.1 |
| BGE-M3 | 0.57 | 63.6 | 34.3 | 43.9 | 54.7 | 45.3 | 39.0 | 54.3 | 47.9 |
| Visual Retrievers | |||||||||
| ColEmbed-3B-v2 | 3 | 78.6 | 52.9 | 69.1 | 67.6 | 65.4 | 56.8 | 71.7 | 66.0 |
| ColEmbed-3B | 3 | 77.8 | 53.4 | 69.5 | 66.9 | 64.9 | 57.0 | 69.4 | 65.6 |
| ColEmbed-1B | 1 | 75.5 | 52.2 | 67.0 | 66.2 | 64.5 | 56.1 | 68.7 | 64.3 |
| Jina-v4 | 3 | 74.2 | 52.4 | 66.1 | 65.2 | 64.6 | 55.9 | 68.7 | 63.9 |
| ColNomic-7B | 7 | 78.2 | 48.2 | 63.1 | 64.6 | 62.9 | 54.2 | 69.6 | 63.0 |
| ColNomic-3B | 3 | 75.5 | 45.5 | 63.0 | 63.7 | 62.6 | 52.8 | 68.6 | 61.7 |
| ColQwen2.5 | 3 | 75.2 | 42.9 | 61.2 | 60.9 | 59.2 | 49.4 | 65.3 | 59.2 |
| Nomic-7B | 7 | 70.9 | 42.3 | 57.6 | 63.8 | 55.9 | 48.5 | 62.0 | 57.3 |
| ColQwen2 | 2 | 73.5 | 44.1 | 50.9 | 58.1 | 54.7 | 49.8 | 63.2 | 56.3 |
| ColPali | 7 | 72.5 | 38.1 | 43.3 | 57.7 | 53.3 | 47.0 | 59.2 | 53.0 |
| Nomic-3B | 3 | 62.1 | 37.2 | 53.3 | 59.2 | 51.9 | 41.1 | 57.2 | 51.7 |
| ColModernVBERT | 0.25 | 59.7 | 42.0 | 50.4 | 56.6 | 47.0 | 43.9 | 55.2 | 50.7 |
| ColSmol-256M | 0.25 | 57.4 | 36.5 | 47.7 | 51.4 | 46.0 | 38.5 | 47.5 | 46.4 |
| Model | Size (B) | Phys. | Ener. | Fin. | Average |
| Textual Retrievers | |||||
| Jina-v4 | 3 | 44.0 | 63.4 | 44.8 | 50.7 |
| Qwen3-8B | 8 | 45.8 | 60.2 | 37.6 | 47.9 |
| Qwen3-0.6B | 0.6 | 43.8 | 54.9 | 28.5 | 42.4 |
| BGE-M3 | 0.57 | 38.3 | 53.1 | 28.4 | 39.9 |
| BM25S | - | 39.8 | 57.4 | 35.9 | 44.4 |
| Visual Retrievers | |||||
| ColEmbed-3B-v2 | 3 | 48.2 | 67.5 | 48.2 | 54.6 |
| ColNomic-7b | 7 | 48.5 | 67.0 | 47.9 | 54.5 |
| ColNomic-3b | 3 | 48.5 | 67.9 | 46.8 | 54.4 |
| Jina-v4 | 3 | 46.8 | 66.7 | 48.6 | 54.0 |
| ColEmbed-3B | 3 | 46.6 | 66.3 | 48.9 | 53.9 |
| ColEmbed-1B | 1 | 44.7 | 64.6 | 47.8 | 52.4 |
| ColQwen2.5 | 3 | 47.8 | 62.3 | 43.6 | 51.2 |
| Nomic-7B | 7 | 45.6 | 61.6 | 41.3 | 49.5 |
| ColQwen2 | 3 | 43.9 | 55.6 | 26.5 | 42.0 |
| Nomic-3B | 3 | 43.6 | 56.4 | 34.4 | 44.8 |
| ColPali | 7 | 43.2 | 50.5 | 23.6 | 39.1 |
Additional Retrieval Modality Performances
To evaluate the hybrid retrieval setup, we use the multimodal Jina-v4 model to generate separate visual and textual rankings. We then construct a hybrid retrieval set by merging the top-5 results from each modality and removing duplicates. Because this set-union operation does not preserve a strict ranking order, we report the unranked F1 score. As shown in Table 7, the hybrid approach consistently outperforms single-modality baselines.
| English Datasets | French Datasets | ||||||||||
| Modality | C.S. | Nucl. | Fin. | Phar. | H.R. | Ind. | Tel. | Phys. | Ener. | Fin. | Avg. |
| Visual | 39.4 | 25.5 | 28.4 | 27.5 | 30.0 | 21.4 | 31.4 | 26.6 | 25.2 | 22.9 | 27.8 |
| Textual | 35.4 | 23.1 | 24.5 | 24.2 | 27.4 | 16.5 | 29.0 | 25.8 | 23.9 | 20.4 | 25.0 |
| Hybrid | 43.0 | 27.7 | 30.9 | 29.7 | 32.6 | 22.2 | 35.5 | 26.5 | 29.8 | 24.3 | 30.2 |
| Avg. # Pages for hybrid | 6.96 | 7.38 | 7.77 | 7.40 | 7.29 | 7.77 | 7.09 | 7.26 | 6.97 | 7.61 | 7.35 |
ColEmbed-3B-v2 performance breakdown
Table 8 details the retrieval scores of ColEmbed-3B-v2 by query language, highlighting small performance variations by language.
Performance by number of annotated pages
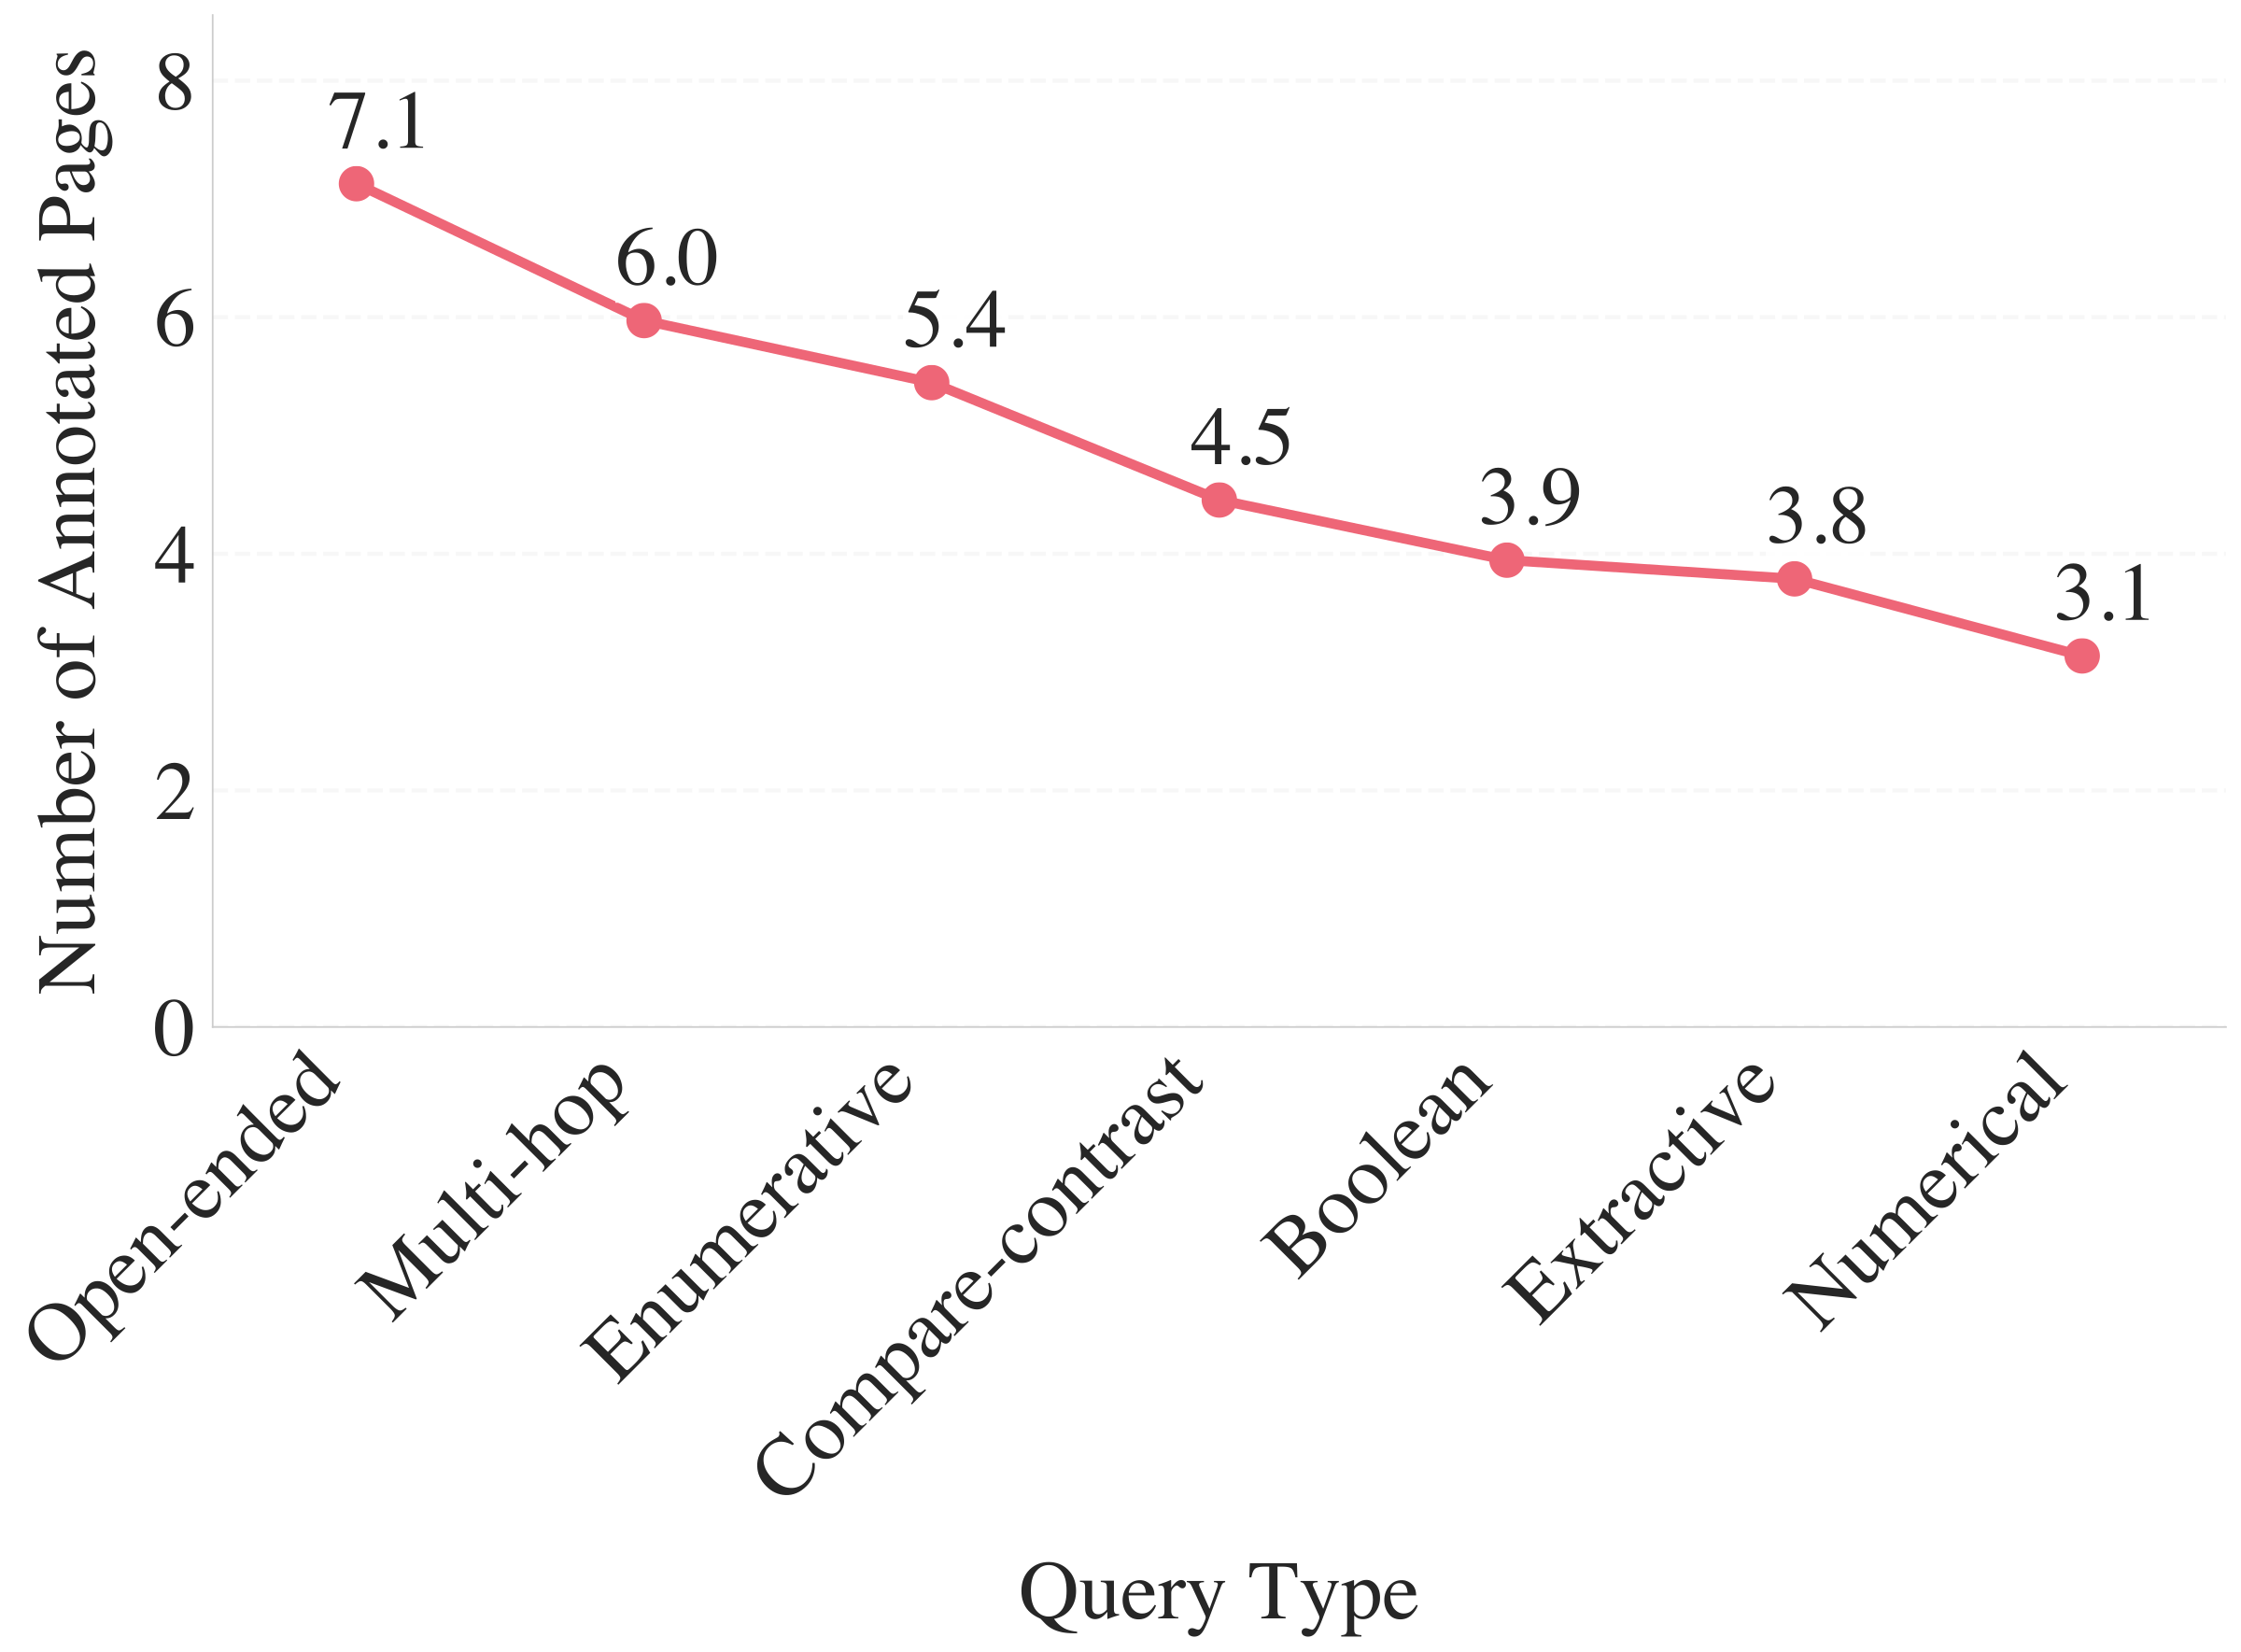
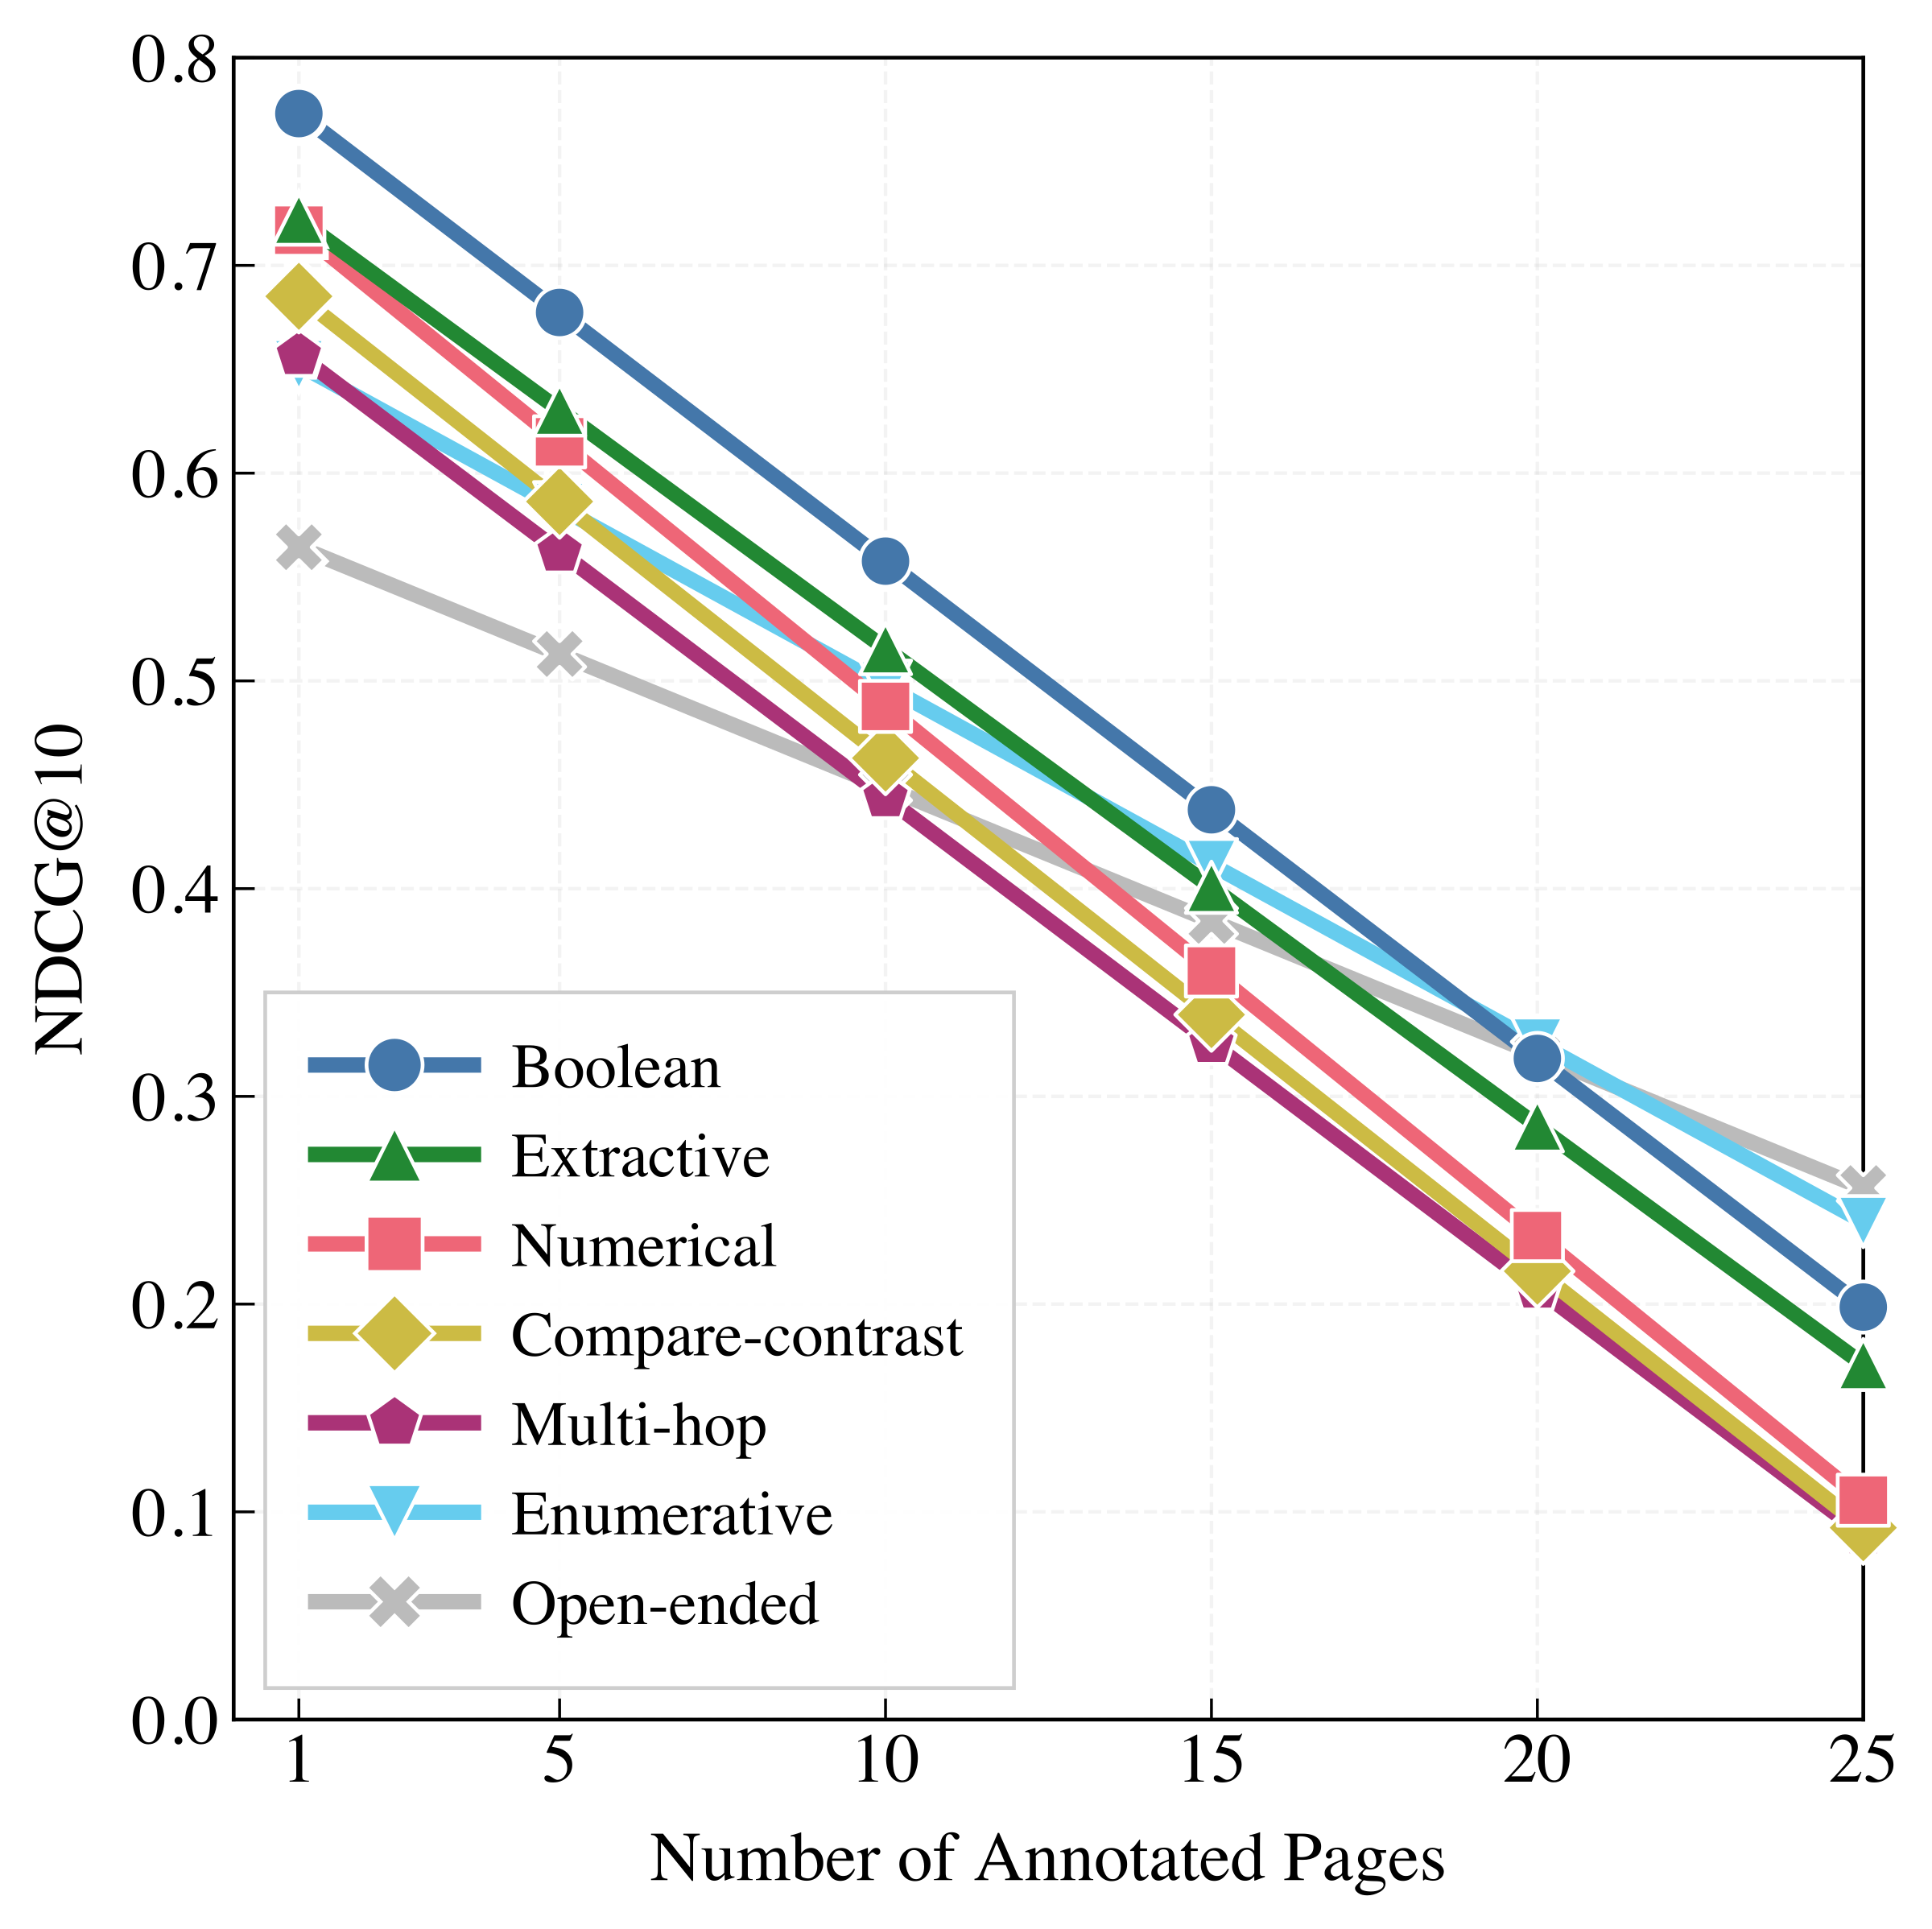
As seen in Figure 7, performance drops with the number of annotated pages. However, a potential confounding factor is the correlation between query type and the number of annotated pages, since more complex query types also have higher number of annotated pages (Figure 4). We perform a stratified regression analysis to isolate these two effects.
We model NDCG@10 as a linear function of the number of annotated pages () stratified by query type. For each of the 7 query types, we fit an ordinary least squares regression:
Results in Figure 5 and Table 9 reveal that all query types suffer a significant performance penalty as the number of annotated pages increases. Slope values are nearly uniform (), suggesting a similar drop in retrieval accuracy across most query types. The open-ended and enumerative types are the two exceptions: despite having the lowest NDCG@10 for low page counts, they also have the shallowest slope, which suggests that retrieval success on these queries is constrained by the model's fundamental difficulty in synthesizing multiple relevant sources rather than the volume of relevant context.
| Query Language | NDCG@10 |
| English | 60.8 |
| French | 59.8 |
| Portuguese | 59.6 |
| Spanish | 59.6 |
| Italian | 59.1 |
| German | 57.9 |
| Query Type | Slope | Intercept | |
| Boolean | -0.0239 | 0.797 | 0.101 |
| Numerical | -0.0255 | 0.742 | 0.059 |
| Extractive | -0.0230 | 0.745 | 0.084 |
| Compare-contrast | -0.0247 | 0.710 | 0.117 |
| Enumerative | -0.0172 | 0.669 | 0.080 |
| Multi-hop | -0.0237 | 0.680 | 0.114 |
| Open-ended | -0.0129 | 0.577 | 0.057 |
Performance by content type
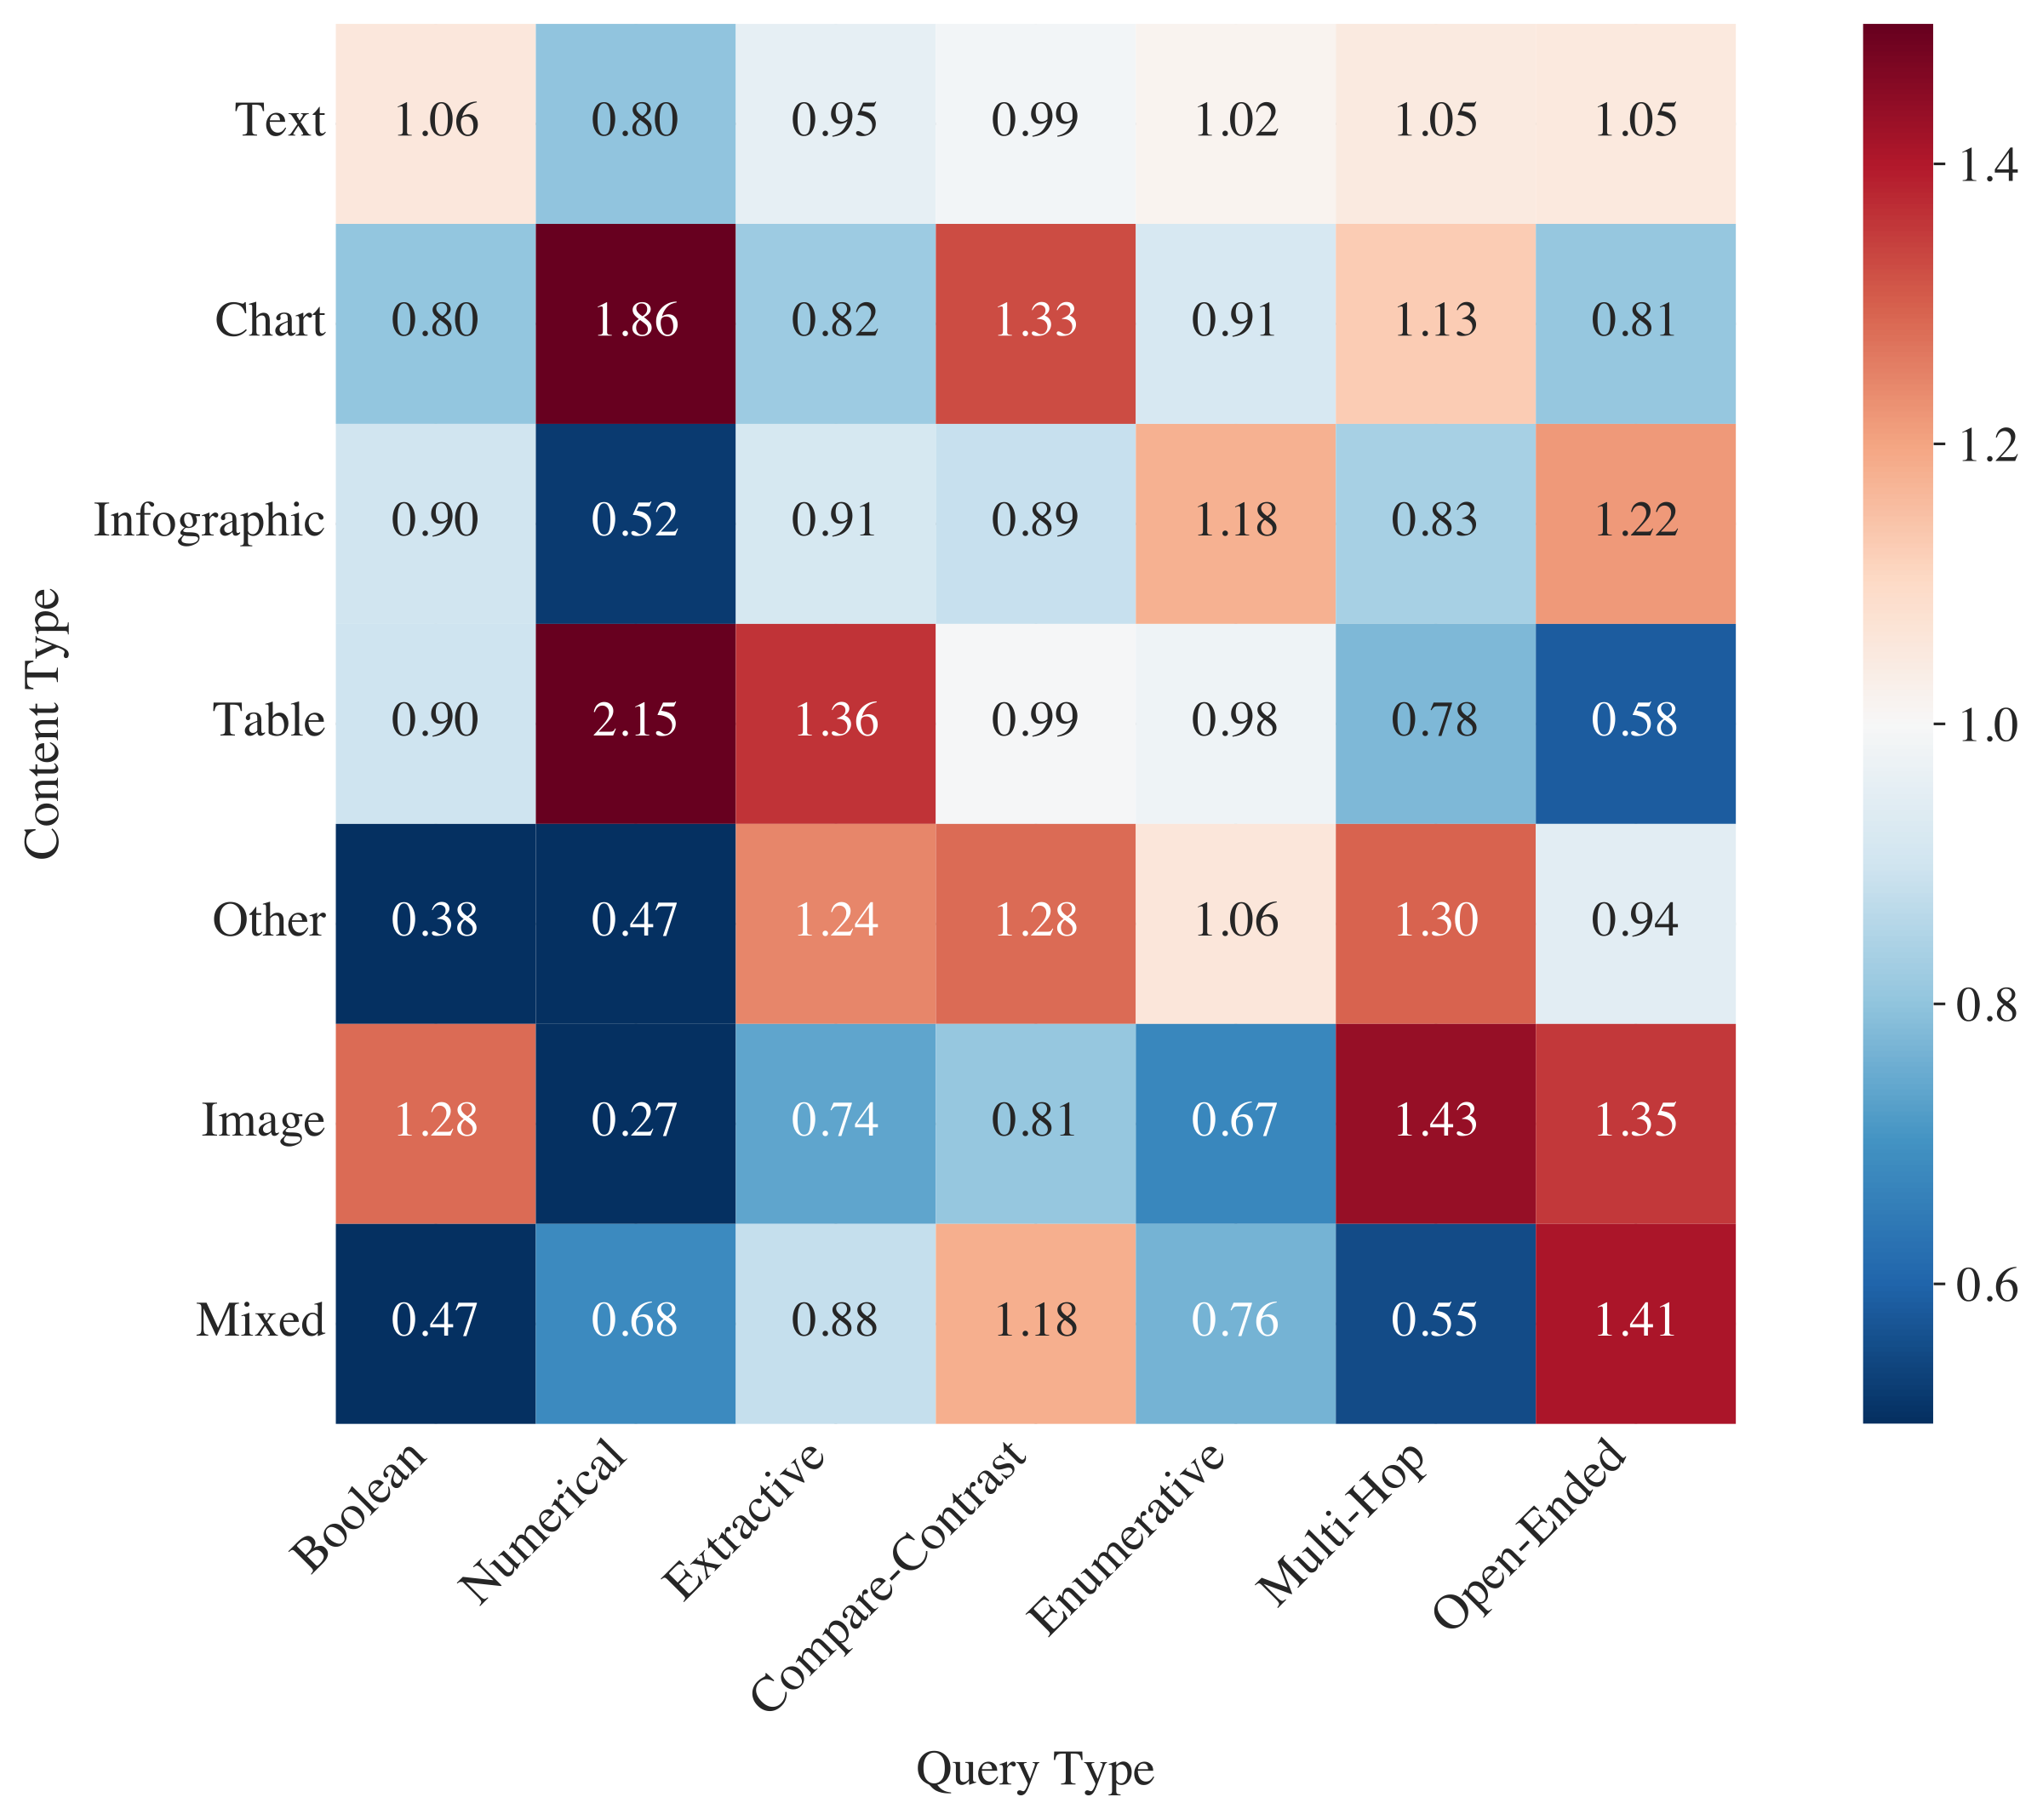
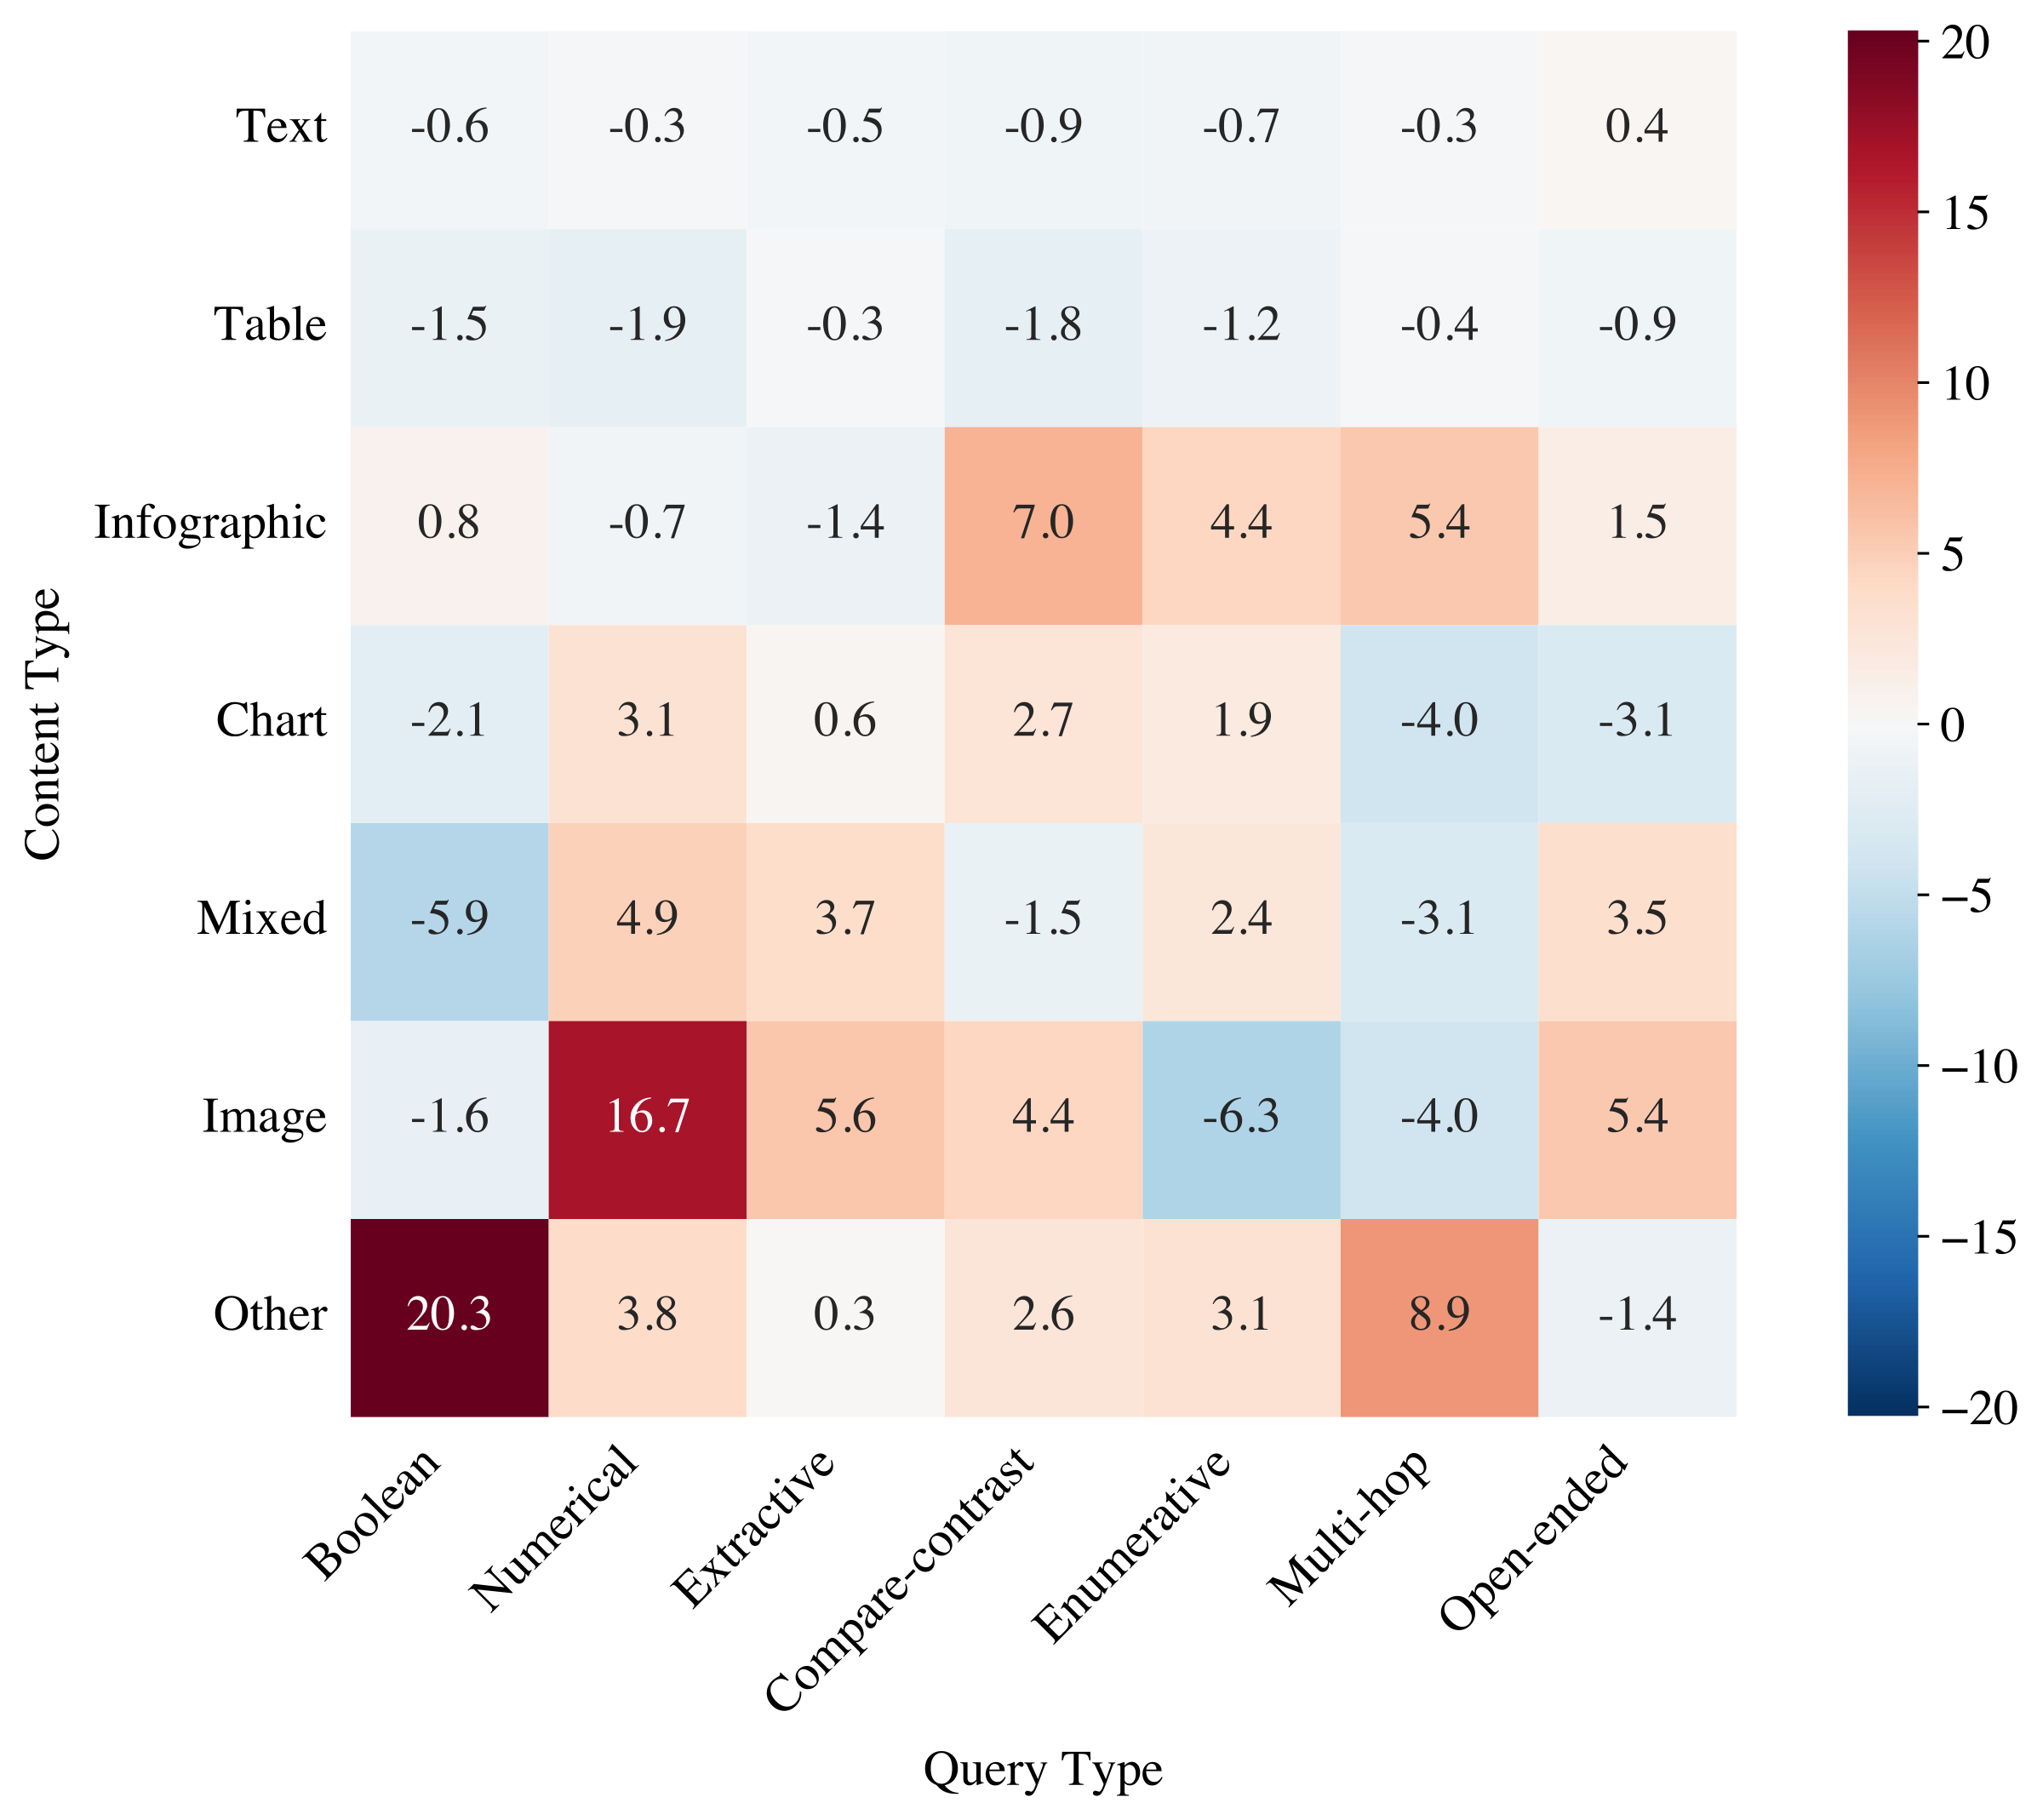
NDCG@10 by content type in Table 10 show that retrieval is more challenging for visual content, with Image performing 10pp below Text. However, content type and query type are correlated in our benchmark: for instance, tables appear in numerical queries 2.2 more often than the baseline, while images are over-represented in open-ended queries (Figure 6). Since numerical queries are easier than open-ended ones, we test whether the effect of content type is a byproduct of query type confounding. We fit an additive model that predicts performance as the sum of independent query-type and content-type effects. Figure 7 shows the residuals which measure deviation from this baseline. We see that most residuals are below 5pp, indicating that the two factors combine additively without significant interaction.
| Content type | NDCG@10 | Content type count |
| Text | 59.3 | 17244 |
| Chart | 56.3 | 2364 |
| Infographic | 55.2 | 2814 |
| Table | 53.9 | 6480 |
| Other | 50.8 | 492 |
| Image | 49.3 | 1140 |
| Mixed | 45.1 | 1164 |
Bounding box annotations
Inter-annotator agreement
Table 11 shows IoU and F1 scores between human annotations, to detail results of Section 4.3.3.
| English Datasets | French Datasets | ||||||||||
| Metric | C.S. | Nucl. | Fin. | Phar. | H.R. | Ind. | Tele. | Phys. | Ener. | Fin. | Average |
| IoU | 0.500 | 0.476 | 0.462 | 0.615 | 0.474 | 0.502 | 0.526 | 0.443 | 0.470 | 0.503 | 0.497 |
| F1 | 0.608 | 0.594 | 0.569 | 0.720 | 0.594 | 0.611 | 0.637 | 0.540 | 0.569 | 0.581 | 0.602 |
Bounding box predictions
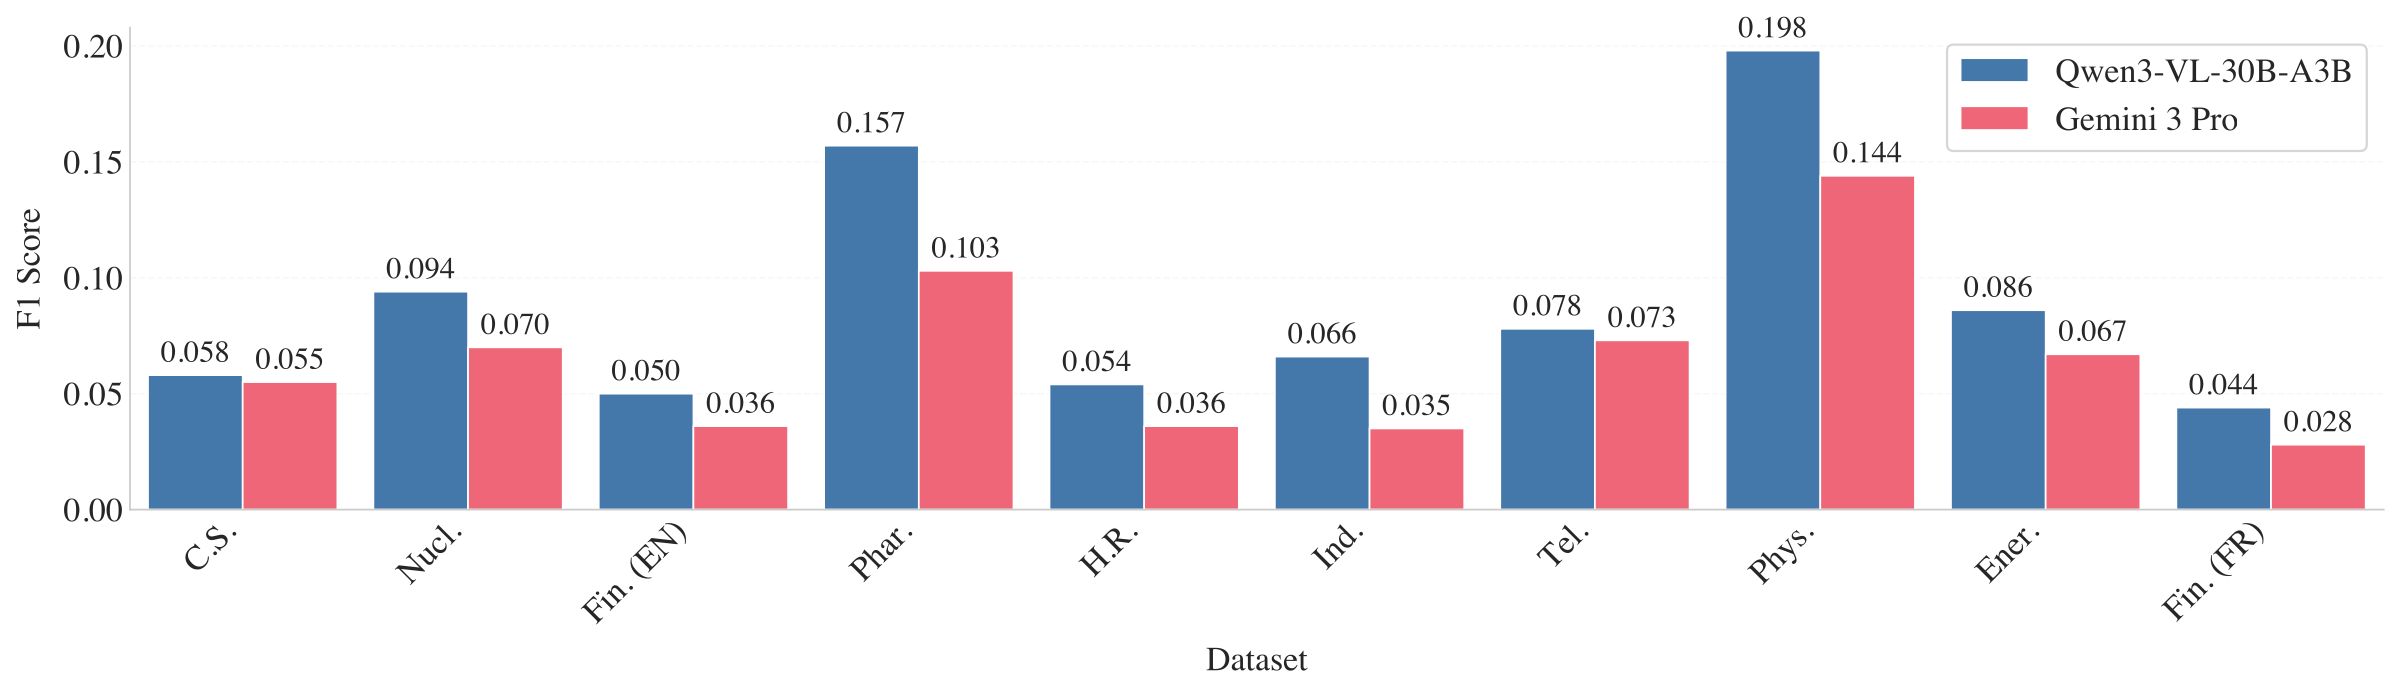
Figure 20 shows the prompt used to generate final answers with inline bounding boxes for visual grounding, and Figure 8 reports bounding box localization F1 scores by dataset.
Final answer evaluation
Evaluation setup
Generated final answers are evaluated in a pass@1 setting using GPT 5.2 with medium reasoning effort as the LLM judge. The judge compares each generated answer against the ground-truth annotation and returns a binary correctness label. The answer generation and judge prompts are shown in Figure 18 and Figure 17 respectively. We evaluated Gemini 3 Pro with low thinking effort, GPT-5 with medium reasoning effort, as well as the thinking version of Qwen3-VL-235B-A22B.
To assess the reliability of our judge, we conducted 5 independent evaluation runs on a fixed set of Gemini 3 Pro outputs. Individual run scores showed minimal fluctuation (mean 72.09 %, %) and high internal consistency (Krippendorff's ), confirming that the judge is consistent given a fixed context.
End-to-End Pipeline Stability
While the judge demonstrates high consistency on fixed inputs, the full evaluation pipeline introduces a second layer of variability: the model's generation process. To quantify the end-to-end variance under rigorous conditions, we performed 5 independent runs. For computational efficiency, we restricted this stress test to the most challenging corpus in each language: Industrial Maintenance (English) and Finance (French).
We measured an average score of 65.74 % with a standard deviation of 0.94 %. Crucially, the evaluation signal remains robust against generative noise, achieving a Krippendorff's of 0.80. This agreement confirms that the end-to-end results are statistically reliable even when subjected to the most difficult evaluation scenarios.
Easy/hard query filtering
To classify queries by difficulty, we prompt a panel of 6 LLMs to answer each query without access to any corpus context. We select GPT-5-nano, GPT-5-mini, GPT-5, Qwen3-VL-30B-A3B, Gemini 2.5 Flash, and Gemini 2.5 Pro to span different model families and capability levels. Each model receives only the query text and is asked to provide a direct answer with the prompt in Figure 16. Answers are evaluated for correctness using the same GPT-5.2 judge described above. A query is labeled easy if at least one model answers correctly, and hard otherwise. Table 12 reports per-model accuracy and the resulting proportion of easy queries for each dataset. The distribution varies substantially across domains: knowledge-intensive datasets such as Computer Science and Physics have over 85% easy queries, while domain-specific datasets such as Finance and Energy contain fewer than 35% easy queries, reflecting the specialized nature of their content.
| English Datasets | French Datasets | ||||||||
| Model | C.S. | Fin. | Phar. | H.R. | Ind. | Phys. | Ener. | Fin. | Total |
| GPT-5-nano | 74.4 | 7.4 | 30.5 | 12.9 | 15.6 | 74.2 | 14.0 | 9.1 | 29.8 |
| GPT-5-mini | 79.1 | 13.3 | 37.4 | 17.6 | 20.5 | 80.1 | 13.6 | 13.1 | 34.3 |
| GPT-5 | 76.3 | 25.2 | 50.8 | 29.9 | 32.2 | 80.5 | 26.0 | 22.2 | 42.9 |
| Qwen3-VL-30B-A3B | 60.9 | 3.9 | 19.2 | 6.3 | 9.9 | 60.9 | 6.8 | 4.4 | 21.5 |
| Gemini 2.5 Flash | 66.1 | 8.7 | 30.8 | 13.5 | 15.9 | 63.6 | 14.9 | 13.1 | 28.3 |
| Gemini 2.5 Pro | 70.2 | 16.8 | 29.4 | 15.4 | 23.7 | 63.9 | 20.5 | 20.0 | 32.9 |
| Easy queries (%) | 86.5 | 31.7 | 57.1 | 36.5 | 38.9 | 86.4 | 32.5 | 30.0 | 48.6 |
Visual grounding examples
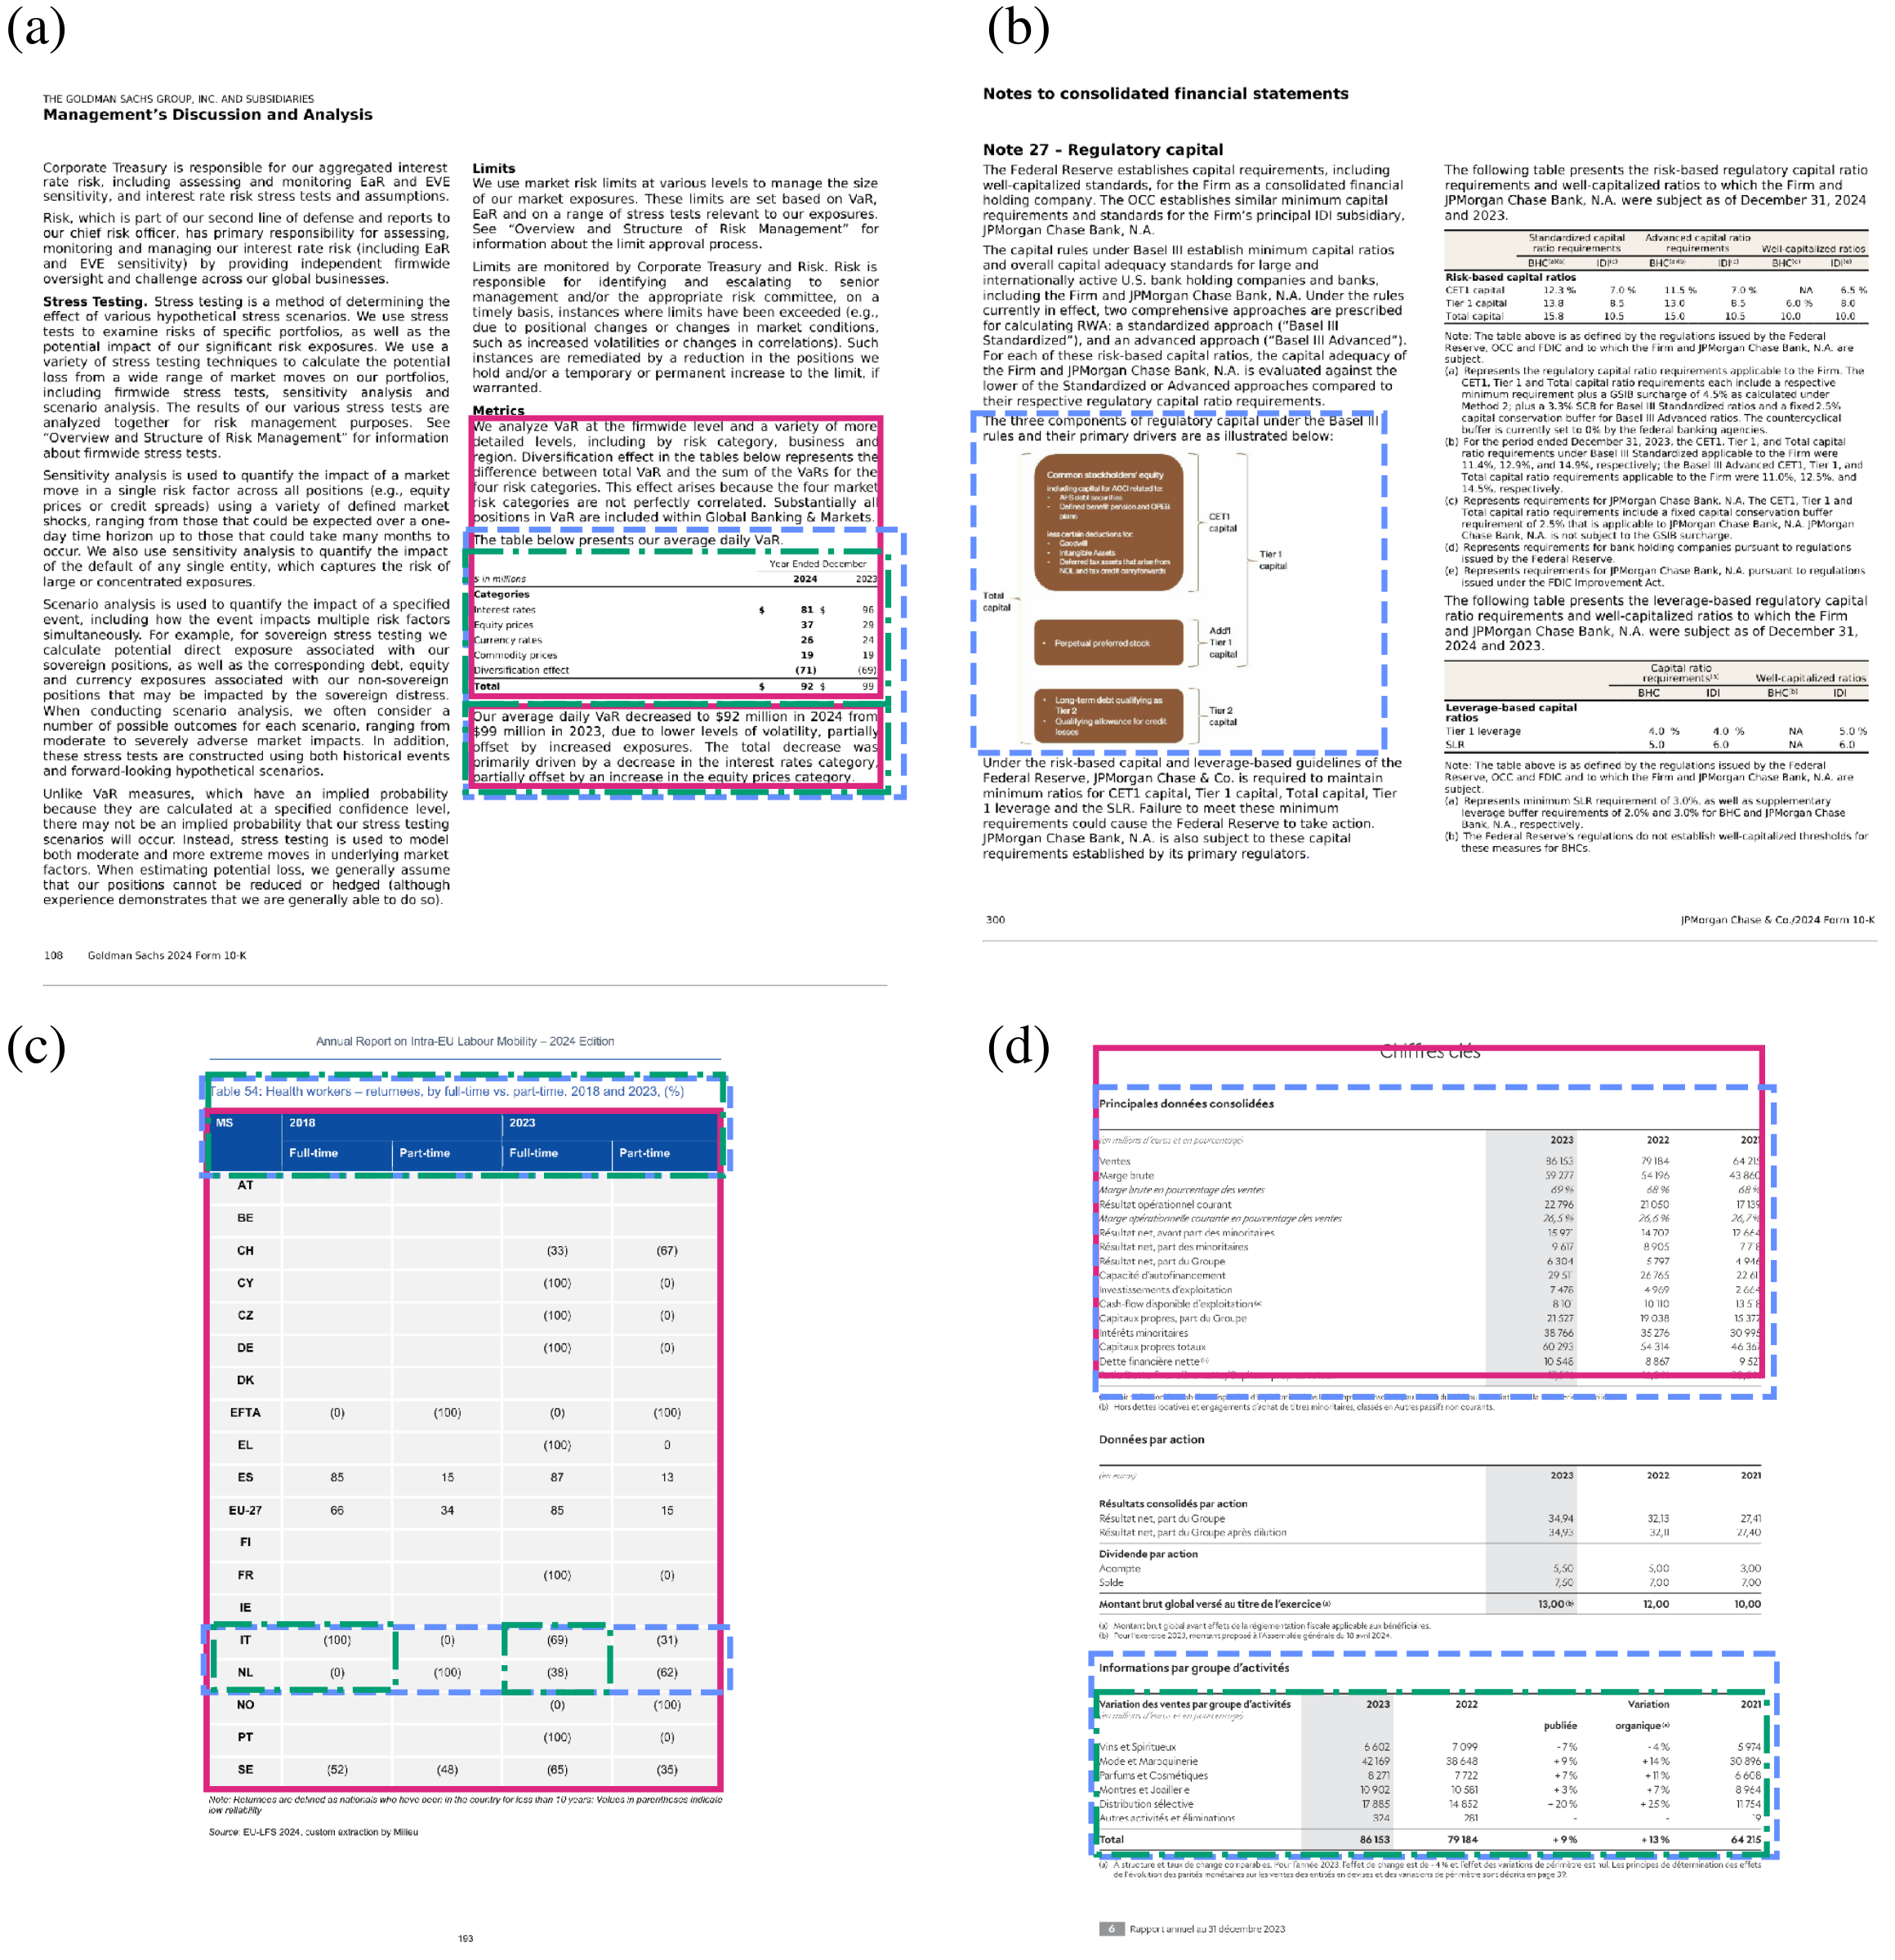
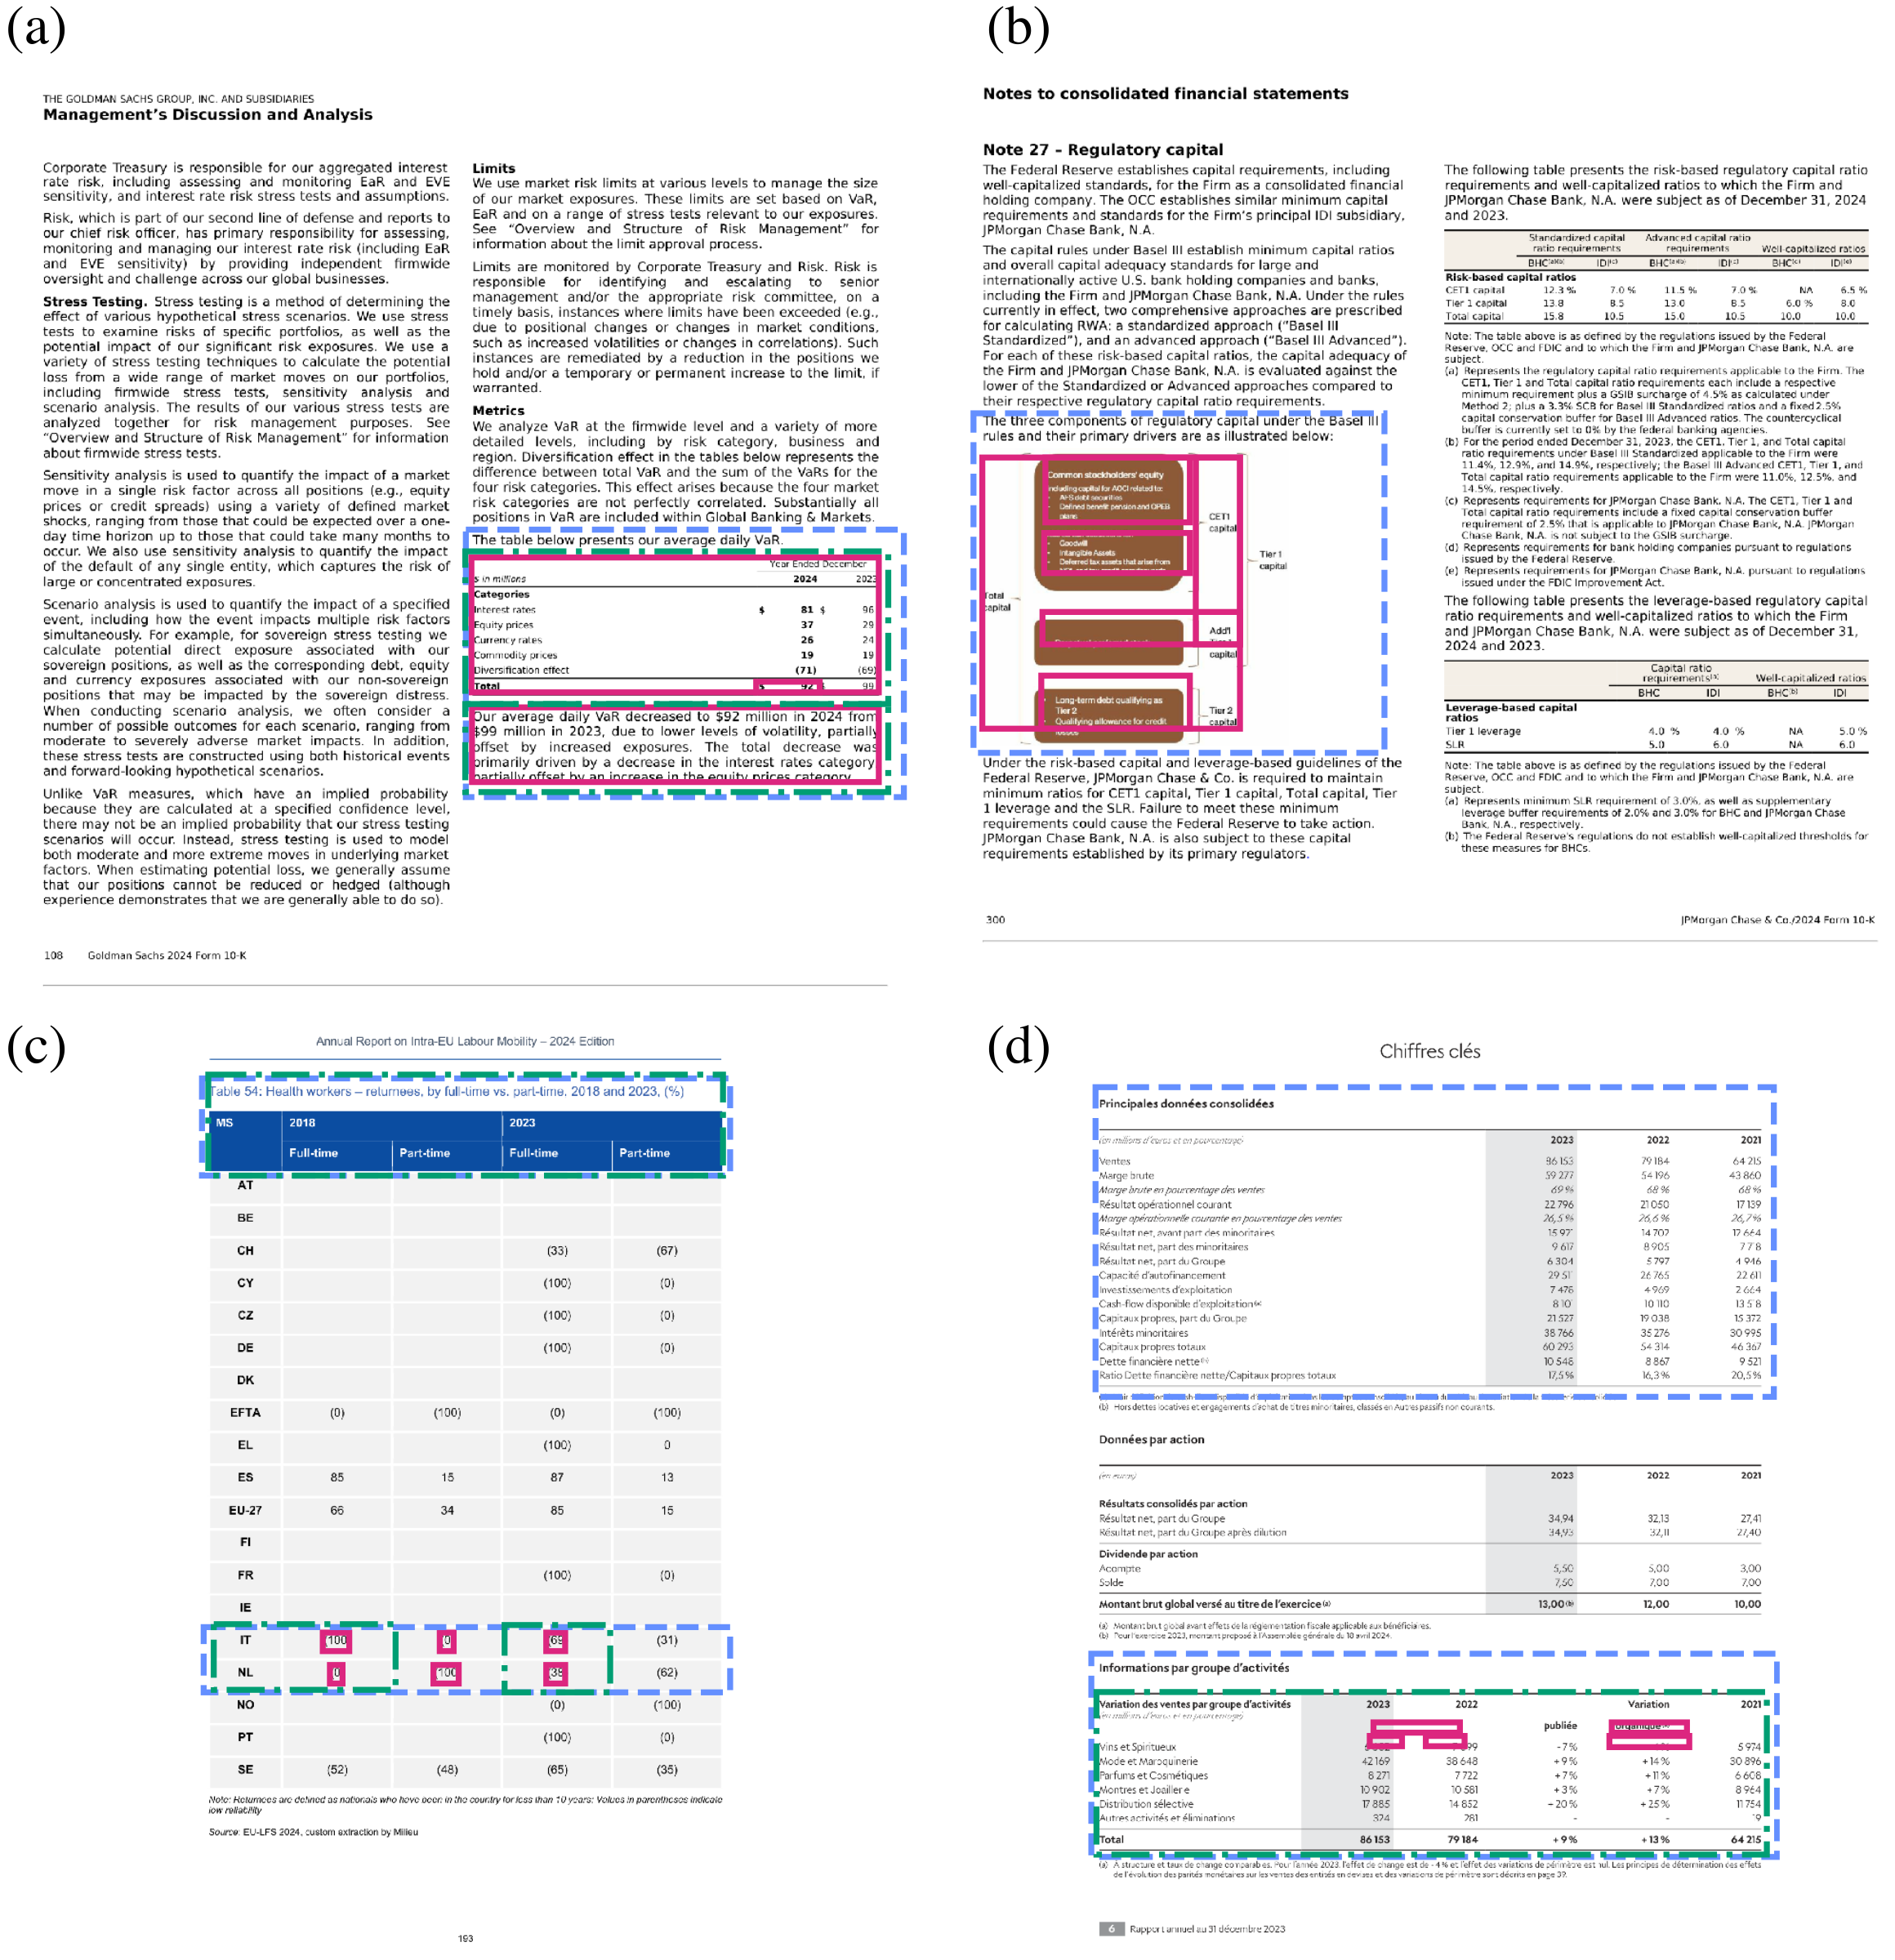
Qualitative analysis reveals distinct failure modes. Gemini frequently produces off-by-one page indexing errors: the predicted coordinates would correctly localize the target content if applied to an adjacent page. The two models also differ in box granularity: Gemini tends to draw tight boxes around individual elements (e.g., a single table cell or text line), whereas Qwen3-VL generates larger boxes encompassing entire sections or paragraphs, more closely matching human annotation patterns. Figures 9 and 10 illustrate these tendencies across four dataset pages: Qwen3-VL's bounding boxes are comparatively wide and encompass entire page elements (pages (a), (c), and (d)), while Gemini 3 Pro's visual grounding is more precise (pages (b) and (c)). This difference in granularity partially explains Qwen3-VL's higher F1 scores, as broader boxes are more likely to overlap with the ground-truth zones used in our evaluation. Both models exhibit errors and omissions: in page (b), the chart is not labeled by Qwen3-VL, and in page (d), Gemini 3 Pro predicts incorrect bounding boxes for the bottom table while Qwen3-VL provides grounding for the wrong table.
Instructions given to Annotators
Query Generation
Figure 11 details step-by-step instructions to annotators to generate queries from summaries and images.
Query-Page Relevancy linking
Figure 12 details the step-by-step instructions provided to annotators for assessing page relevance, identifying content modalities, and localizing evidence via bounding boxes. Table 13 gives the definitions of relevancy scores used by the human annotators.
| Score | Label | Definition |
| 2 | Fully Relevant | The page contains the complete answer. |
| 1 | Critically Relevant | The page contains facts or information required to answer the query, though additional information is required. |
| 0 | Not Relevant | Provides no information relevant to the query. |
Prompts
All the prompts used for both dataset generation and evaluations are detailed from Figure 13 to Figure 20.
References
- Yanzhao Zhang, Mingxin Li, Dingkun Long, Xin Zhang, Huan Lin, Baosong Yang, Pengjun Xie, An Yang, Dayiheng Liu, Junyang Lin, Fei Huang, Jingren Zhou (2025). Qwen3 Embedding: Advancing Text Embedding and Reranking Through Foundation Models. Source ↗
- Michael Günther, Saba Sturua, Mohammad Kalim Akram, Isabelle Mohr, Andrei Ungureanu, Bo Wang, Sedigheh Eslami, Scott Martens, Maximilian Werk, Nan Wang, Han Xiao (2025). jina-embeddings-v4: Universal Embeddings for Multimodal Multilingual Retrieval. Source ↗
- Liquid AI (2025). LFM2 Technical Report.
- Jianlv Chen, Shitao Xiao, Peitian Zhang, Kun Luo, Defu Lian, Zheng Liu (2024). BGE M3-Embedding: Multi-Lingual, Multi-Functionality, Multi-Granularity Text Embeddings Through Self-Knowledge Distillation. arXiv. Source ↗
- Xing Han Lù (2024). BM25S: Orders of magnitude faster lexical search via eager sparse scoring. Source ↗
- Mengyao Xu, Gabriel Moreira, Ronay Ak, Radek Osmulski, Yauhen Babakhin, Zhiding Yu, Benedikt Schifferer, Even Oldridge (2025). Llama Nemoretriever Colembed: Top-Performing Text-Image Retrieval Model. Source ↗
- Nomic Team (2025). Nomic Embed Multimodal: Interleaved Text, Image, and Screenshots for Visual Document Retrieval. Nomic AI. Source ↗
- Manuel Faysse, Hugues Sibille, Tony Wu, Bilel Omrani, Gautier Viaud, Céline Hudelot, Pierre Colombo (2025). ColPali: Efficient Document Retrieval with Vision Language Models. International Conference on Learning Representations (ICLR 2025). Source ↗
- Rikiya Takehi, Benjamin Clavié, Sean Lee, Aamir Shakir (2025). Fantastic (small) Retrievers and How to Train Them: mxbai-edge-colbert-v0 Tech Report. Source ↗
- Antoine Chaffin (2025). GTE-ModernColBERT. Source ↗
- Paul Teiletche, Quentin Macé, Max Conti, Antonio Loison, Gautier Viaud, Pierre Colombo, Manuel Faysse (2026). ModernVBERT: Towards Smaller Visual Document Retrievers. International Conference on Machine Learning (ICML 2026). Source ↗
- Andrés Marafioti, Orr Zohar, Miquel Farré, Merve Noyan, Elie Bakouch, Pedro Cuenca, Cyril Zakka, Loubna Ben Allal, Anton Lozhkov, Nouamane Tazi, Vaibhav Srivastav, Joshua Lochner, Hugo Larcher, Mathieu Morlon, Lewis Tunstall, Leandro von Werra, Thomas Wolf (2025). SmolVLM: Redefining small and efficient multimodal models. Source ↗